After having run the “NCA” task to calculate the NCA PK parameters, the “Bioequivalence” task can be launched to compare the calculated PK parameters between two groups, usually one receiving the “test” formulation and one the “reference” formulation.
Bioequivalence task
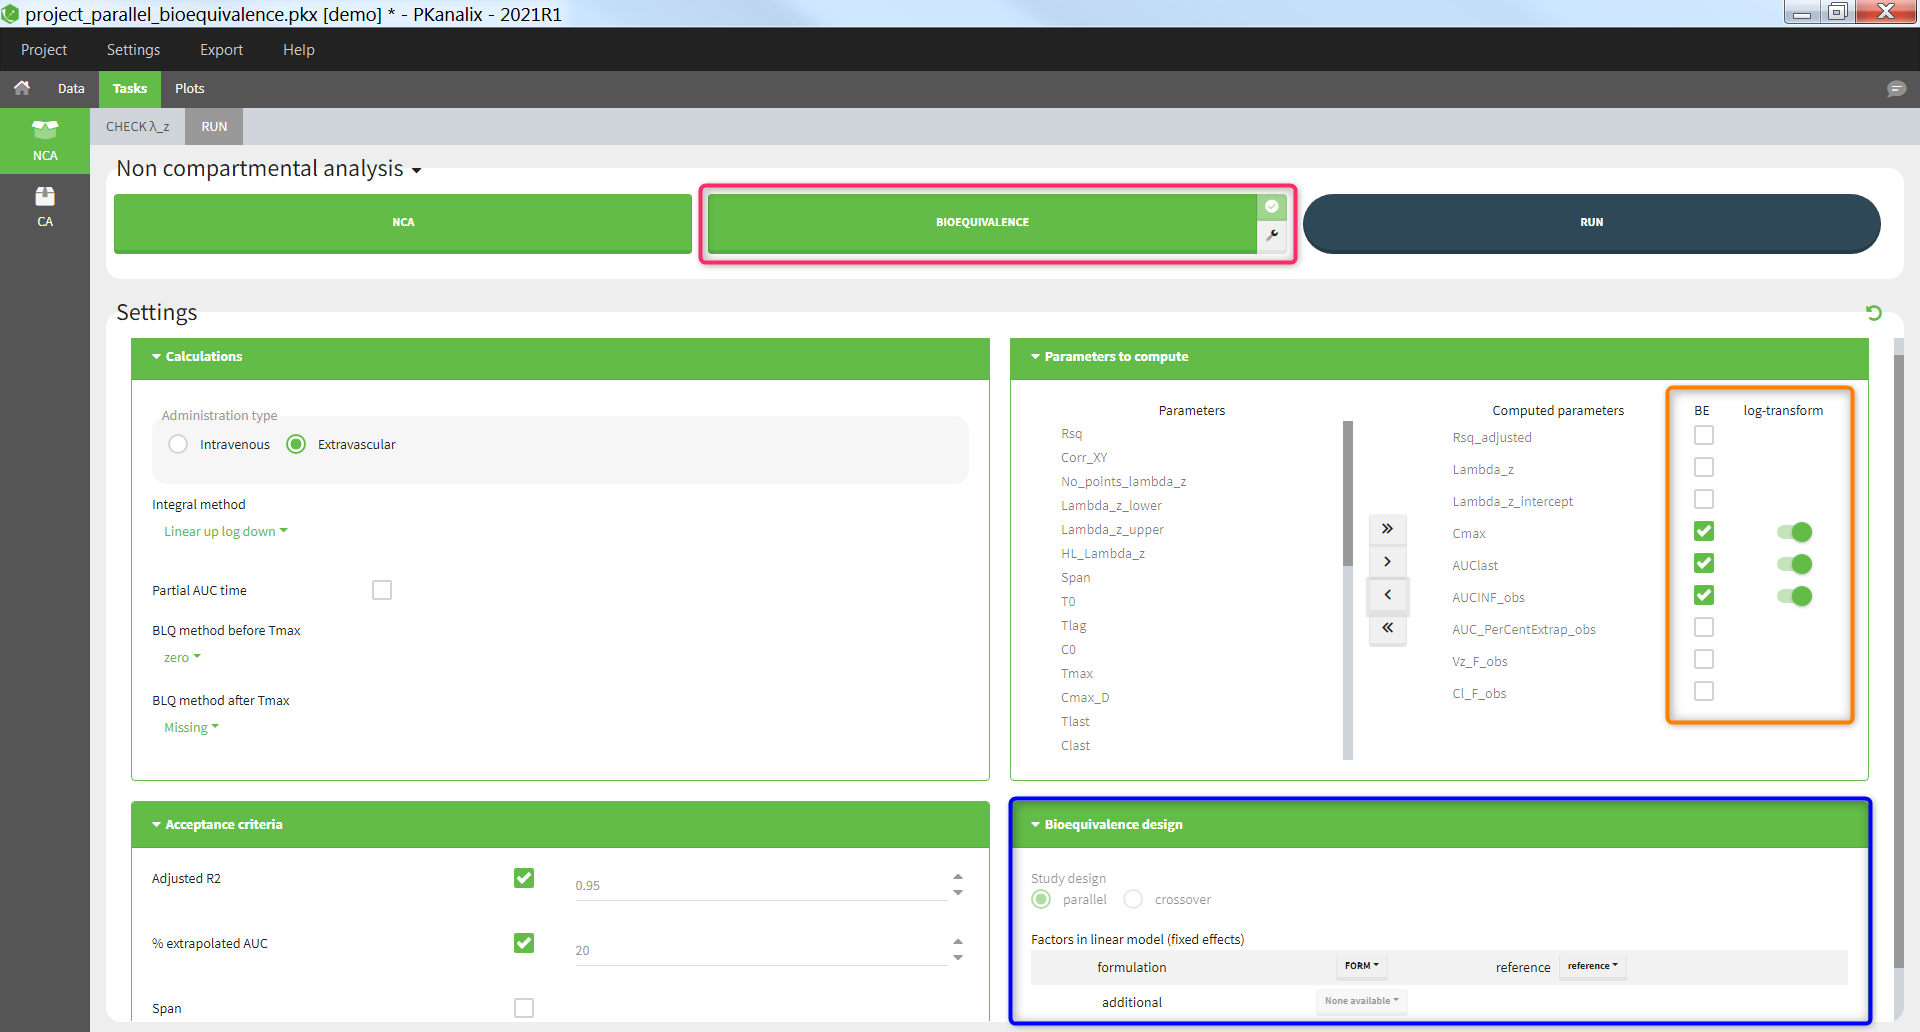
The task “Bioequivalence” is available if at least one categorical covariate column has been tagged in the “Data” tab. The “Bioequivalence” task can only be run after having run the “NCA” task. It can be run by clicking on the “Bioequivalence” task button (pink highlight below) or by selecting it as part of the scenario (tickbox in the upper right corner of the “Bioequivalence” button) and clicking the “Run” button. The parameters to be included in the bioequivalence analysis are selected in the box “Parameters to compute / BE” (orange highlight), where the user can also indicate if the parameter should be log-transformed or not. The fixed effect included in the linear model can be chosen in the box “Bioequivalence design” (blue highlight).
Bioequivalence results
The results of the bioequivalence analysis are presented in the “Results” tab, in the “BE” subtab. Three tables are proposed.
Confidence intervals
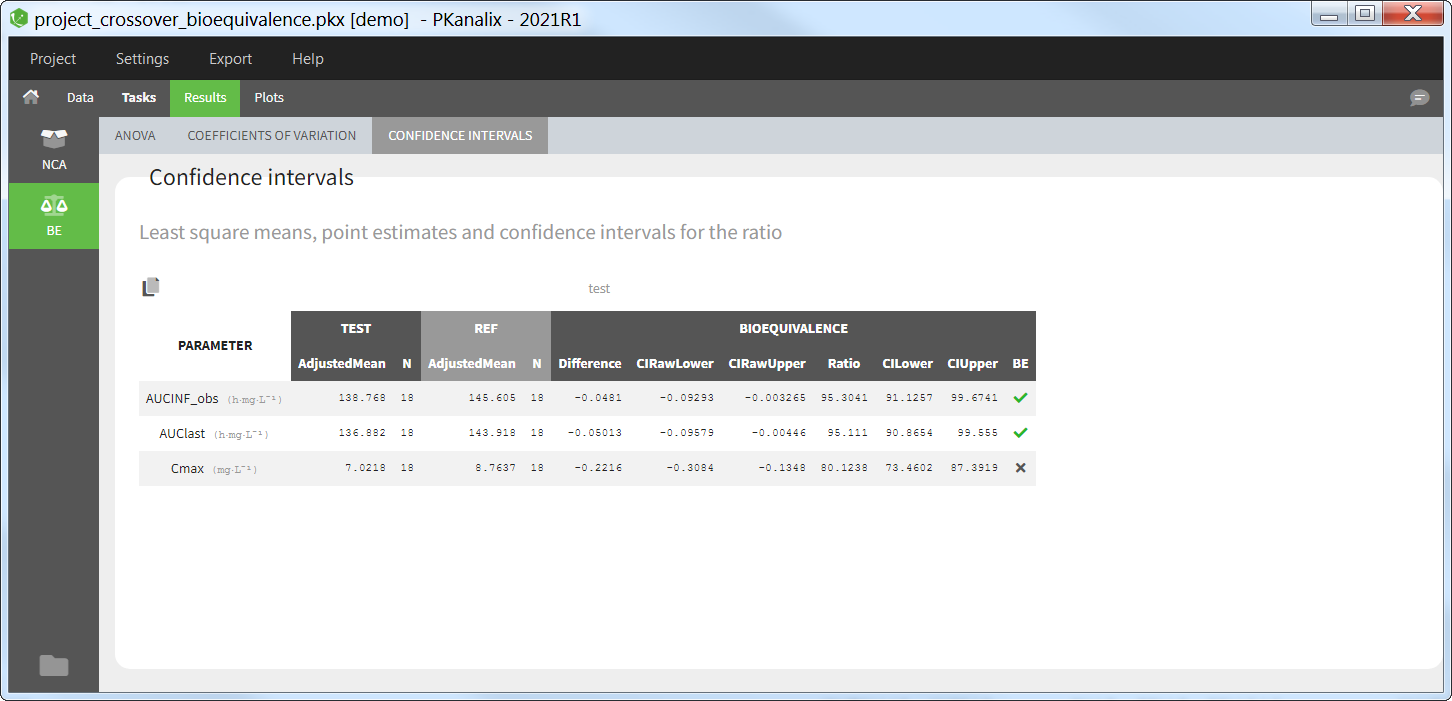
The table of confidence intervals is the key bioequivalence table that allows to conclude if the two formulations are equivalent or not. For each parameter selected for bioequivalence analysis, the following information is given:
- the adjusted means (i.e least square means) for each formulation,
- the number of individuals for each formulation,
- the formulation difference (see calculation rules) and the corresponding confidence interval,
- the formulation ratio (see calculation rules) and the corresponding confidence interval.
If N formulations are present in the dataset, N-1 tables are shown.
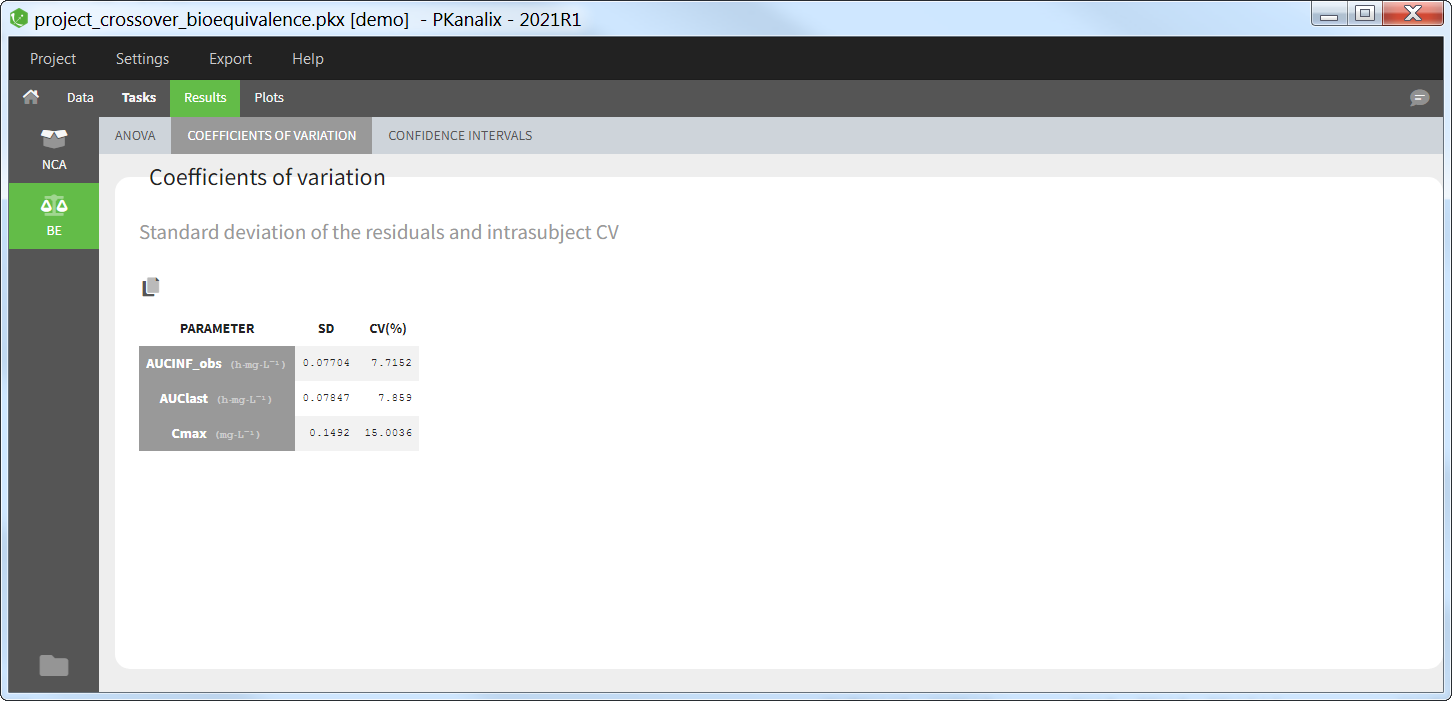
Coefficient of variation
This table gives for each parameter selected for bioequivalence analysis the standard deviation of the residuals and the intra-subject coefficient of variation (CV).
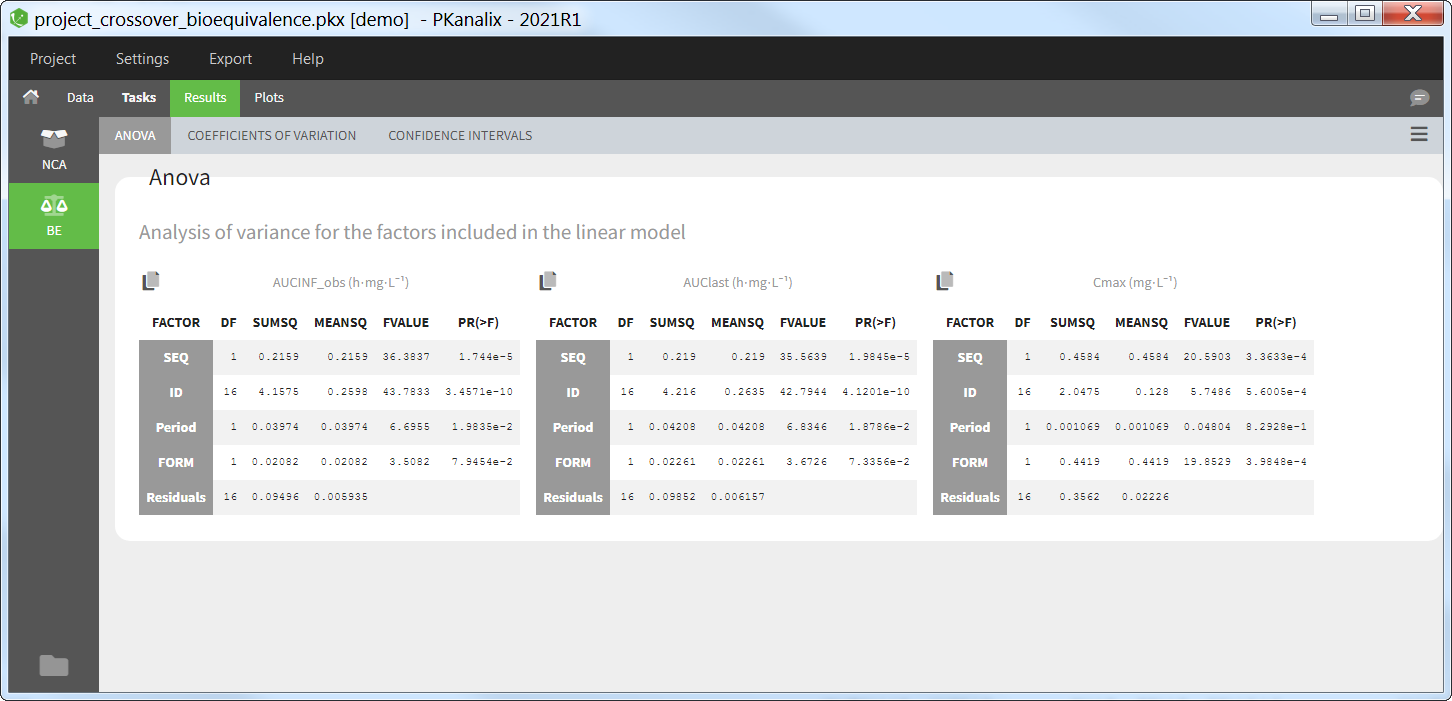
ANOVA
This table presents the analysis of variance (ANOVA) for the factors included in the linear model, for each parameter selected for the bioequivalence analysis. For each factor, the degrees of freedom (DF), sum of squares (SUMSQ), mean squares (MEANSQ), F-value (FVALUE) and the p-value (PR(>F)) are given. A small p-value indicates a significant effect of the corresponding factor.
For the residuals, only the degrees of freedom (DF), sum of squares (SUMSQ), and mean squares (MEANSQ) are given.
Bioequivalence plots
In the “Plots” tab, several plots are displayed:
- Sequence by period: This plot allows to visualize, for each parameter, the mean and standard deviation for each period, sequence and formulation.
- Subject by formulation: This plot allows to visualize, for each parameter, the subject-by-formulation interaction and the inter-subject variability.
- Confidence intervals: This plot gives a visual representation of the confidence intervals of the ratio of each parameter.
- NCA individual fits: This plot can also be used to display the individual concentration data with one subplot per individual with all its periods.
Bioequivalence outputs
After running the Bioequivalence task, the following files are available in the result folder <result folder>/PKanalix/IndividualParameters/be:
- anova_XXX.txt: these is one such file for each NCA parameter included in the bioequivalence analysis. It contains the ANOVA table with columns ‘Factor’ (factors included in the linear model), ‘Df’ (degrees of freedom), ‘SumSq’ (sum of squares), ‘MeanSq’ (mean squares), ‘FValue’ (F-value), ‘Pr(>F)’ (p-value). For the residuals (last line), the two last columns are empty.
- confidenceInterval_XXX.txt: these is one such file per non-reference formulation. It contains the confidence interval table with columns ‘Parameter’ (parameter name), ‘AdjustedMeanTest’ (adjusted mean for the test formulation), ‘NTest’ (number of individuals for the test formulation), ‘AdjustedMeanRef’ (adjusted mean for the reference formulation), ‘NRef’ (number of individuals for the ref formulation), ‘Difference’ (formulation difference – see calculation rules), ‘CIRawLower’ (lower confidence interval bound for the difference), ‘CIRawUpper’ (upper confidence interval bound for the difference), ‘Ratio’ (formulation ratio – see calculation rules), ‘CILower’ (lower confidence interval bound for the ratio), ‘CIUpper’ (upper confidence interval bound for the ratio), ‘Bioequivalence’ (1 if the CI for the ratio falls within the BE limits, 0 otherwise)
- estimatedCoefficients_XXX.txt: these is one such file for each NCA parameter included in the bioequivalence analysis. It contains the estimated coefficient for each category of each factor included in the linear model, as well as the intercept. This information is only available as an output table and is not displayed in the GUI. The table columns are ‘name’ (factor followed by the category), ‘estimate’ (estimated coefficient), ‘se’ (standard error), ‘tValue’ (estimate divided by the SE), and ‘Pr(>|t|)’ (p-value).
- variationCoef.txt: This file contains the standard deviation and coefficient of variation from each NCA parameter. Columns are ‘Parameter’, ‘SD’ and ‘CV(%)’