Starting from the 2023R1 version of the MonolixSuite, PKanalix includes a feature of automated report generation. This feature is available in PKanalix through Export > Generate report. After defining settings in the window that pops up and clicking on the Generate report button, a report in the form of a Microsoft Word (docx) document will be generated in the specified directory. Note that reports generated using command line and lixoftConnectors will contain tables but no plots. Reporting module is not available on CentOS 7.
Here we explain:
- Different strategies for report generation
- How to generate a default report
- How to generate a report using a user-provided template file
- How to rename words and phrases used by PKanalix in generated reports
- How to generate a report using command line arguments
To see examples of a full workflow of report generation in PKanalix, you can visit this page.
Report generation strategies
When selecting Export > Generate report…, there are two different strategies available for report generation:
- Using a default template file – choosing this option will generate the report containing tables of NCA settings, individual NCA metrics, summary of NCA metrics, BE settings and results, CA settings, individual CA parameters, summary of CA parameters and CA cost, as well as all plots available in the interface using their current settings. This option allow to obtain a basic report with all results in one click.
- Using a custom template file – if users choose this option, they will be required to provide a path to the template word file which contains placeholders that will be replaced by tables, plots and keywords when generating the report.
Several other options are available in the pop-up window after the Generate report option is clicked on:
- Document watermark – users can specify a custom text that will appear as a watermark in the report. Font family, font size, color, layout and transparency can be specified, if text is entered into the Text input widget.
- Generated report file – users can choose if the generated report will be saved next to the project file (in that case only the name of the generated report file needs to be given to PKanalix) or in a custom directory (absolute path that includes the generated report file name needs to be given).
- Table styles (only when the custom template file option is selected) – users can choose a style for tables from the list of styles available by default in Microsoft Word. This setting can be overridden by specifying the style directly in the table placeholder. This way custom user-created or company-specific styles can be used.
Default template file
Selecting the option to use the default template file to generate a report gives users a possibility to quickly generate a document containing results of an analysis.
Such a report will consist of:
- name of the PKnaalix project
- data set file name,
- a date of report generation,
- a table containing settings used in NCA analysis (if NCA was run),
- a table of individual NCA parameters with mean and CV% (if NCA was run),
- a table with a summary of NCA parameters (if NCA was run),
- a table with BE settings (if BE was run),
- a table with results of BE analysis (if BE was run),
- a table of compartmental analysis (CA) calculation settings (if CA was run),
- a table of individual CA parameters and costs with mean and CV% (if CA was run),
- a table with a summary of CA parameters (if CA was run),
- a table with total cost, -2LL, AIC and BIC (if CA was run),
- all plots displayed in the GUI with settings currently defined in the interface.
By clicking on View default template, a Word document containing placeholders for all the elements that will be present in the generated report can be downloaded. This document can then be used as a basis for the creation of a custom template file.
Custom template file
The option to use the custom template file can be selected if a user has previously created a Word document (a template) that typically contains placeholders to be replaced by project-specific information, such as tables of results, plots or settings used in a project. Placeholders are strings with a specific syntax that define the settings and layout with which tables and plots will be generated during the report generation process.
For example, in the picture below, a template file on the right contains a placeholder for the observed data plot. So, after report generation, the report file on the right contains a plot for the observed data instead of this placeholder.

Using placeholders
There are three types of placeholders that can be used:
Placeholders for project settings are of format %keyword% and, during the report generation step, they will be replaced by project or global PKanalix settings. For example, if a custom template file contains the placeholder %NCA_integralMethod%, this placeholder will be replaced by the integral method (e.g “linear up log down”) used by a PKanalix project for which the report is being generated. The list of all project settings placeholders can be found here.
Placeholders for plots are of format <lixoftPLH>settings</lixoftPLH> and, during the report generation step, they will be replaced by plots that are available in the PKanalix user interface. Placeholders for plots contain settings that describe how the generated plots should look like. All settings that are available for plots in the interface are available in reporting as well, with addition of several others that describe plot dimensions and display of captions. The list of the main plot settings placeholders can be found here.
Placeholders for tables are also of format <lixoftPLH>settings</lixoftPLH>. Placeholders for tables contain settings that describe how the generated table should look like and they allow more flexibility in the layout compared to the display of tables in the GUI. Indeed, table placeholders can contain settings that result in generated tables being different from the ones available in the Results tab of the PKanalix interface, such as an option to choose which rows or columns to include in the table, or to split tables in a different direction that the one present in interface. Here is the list of all settings that can be used for table placeholders.
Placeholders do not need to be written by the users. They can be generated through the interface, using the Copy reporting placeholder (![]() ) button which can be found next to every plot and results table. Clicking on this button will display the corresponding placeholder in a pop-up window. The displayed placeholder can then be copied to a template file and will be replaced by the table or plot, exactly as they are shown in the interface, with all stratification options and display settings applied.
) button which can be found next to every plot and results table. Clicking on this button will display the corresponding placeholder in a pop-up window. The displayed placeholder can then be copied to a template file and will be replaced by the table or plot, exactly as they are shown in the interface, with all stratification options and display settings applied.
Let’s take a look at how “Copy reporting placeholder” buttons work on a specific example. If we load the demo project_censoring.pkx, go to the Observed data plot and click on the Copy reporting placeholder button above the plot, a pop-up window will appear containing the placeholder for the plot, which can then be used in a report template to generate the plot that looks exactly like the plot currently shown in the interface. As you can see on the screenshot below, the placeholder contains information about plot type, plot size, caption and axes labels.


If we now close the pop-up, enable legend and open the pop-up again, the placeholder will contain the enabled legend setting and, if we put the placeholder in a report template, the generated plot will have a legend present in its corner, as shown in the screenshot on the right.


If we would like our report to have the Observed data plot stratified by a categorical covariate, STUDY, we can stratify the plot in the interface and click on the Copy reporting placeholder button again to generate a placeholder for this plot, as shown on the images below. You can notice that the generated placeholder now contains settings stratification and layout, which control stratification and plot layout.


There are several options present inside the “Placeholder for Report Template” pop-up:
- indent – determines number of spaces used for indentation of settings in the placeholder,
- flow level – determines the compactness of placeholders, i.e how often we start a new line (lower the number, more compact the placeholder will be),
- dimensions units – gives the ability to choose if width and height will be in cm or inches,
- lock aspect ratio – if on, changing width or height will change the other dimension to keep the aspect ratio present on the screen.
It is possible to edit placeholders directly inside the pop-up. Clicking on the Preview button will generate and open a Word document containing a plot or a table described with the placeholder. This option is especially useful when a user manually modifies placeholders, to check if the syntax and the behavior are correct.
Copy to clipboard button will copy the placeholder with the <lixoftPLH> tag, ready to be pasted to the custom Word template.
Using areTaskResultsAvailable
Besides placeholders, templates can include the areTaskResultsAvailable tag, which can be used to display part of the template conditionally in the report.
For example, if a template contains the text:
<? areTaskResultsAvailable(nca) ?>
Show this if NCA has been run
</?>
The text “Show this if NCA has been run” will be present in the generated report, only if NCA results are available, otherwise the tags and the text will not be present in the generated report. Besides text, it is possible to include placeholders inside the areTaskResultsAvailable tag. Keywords that can be used inside the parentheses are “nca” for non-compartmental analysis, “be” for bioequivalence and “ca” for compartmental analysis.
Renamings
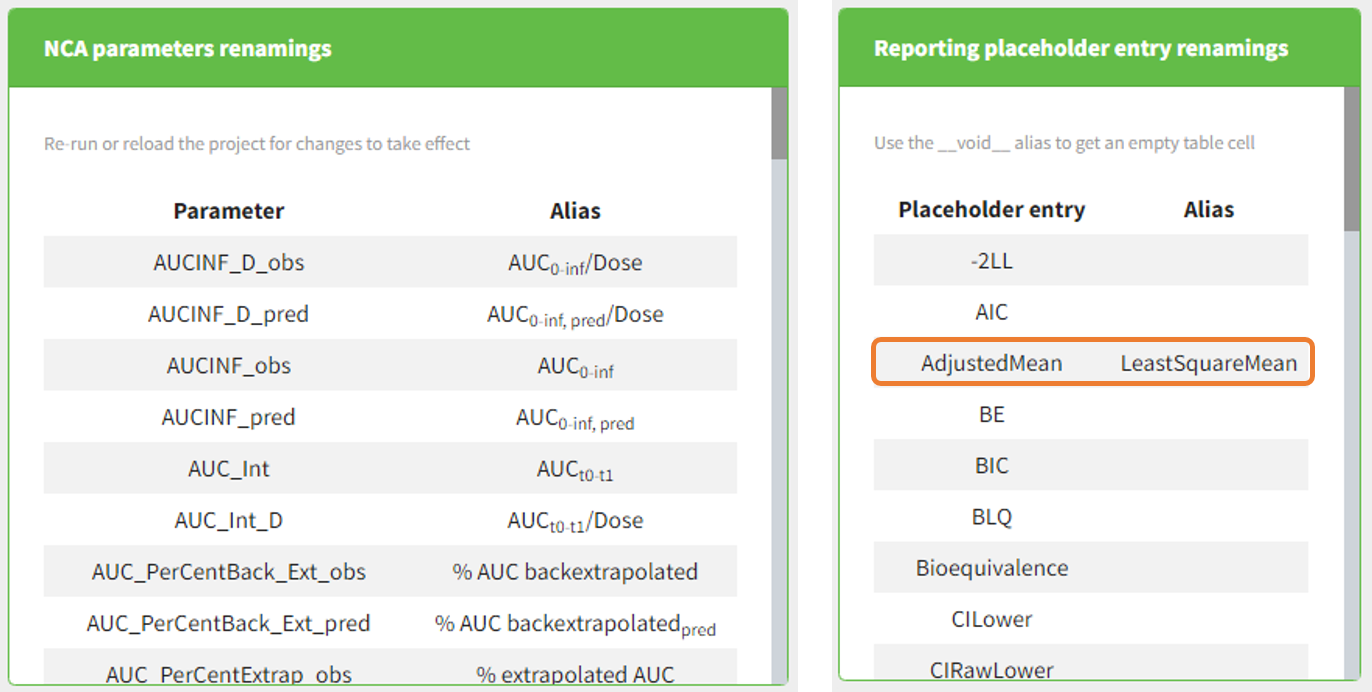
In the PKanalix Preferences, there is an option to replace default names of NCA parameters by custom names (see screenshot below). Changing these options will change the names in the interface (after restarting the program) and in generated reports.
A section Reporting placeholder entry renamings in Preferences can be used to change words and phrases that will appear in generated reports by default. For example, if we give alias “LeastSquareMean” to a placeholder entry “AdjustedMean”, the word “AdjustedMean” in the BE table generated by the reporting feature will be replaced by the word “LeastSquareMean”.
In addition, it is possible to rename words found in generated tables, by specifying an argument renamings inside the placeholder. This allows users to change words present in the data set as well. For example, if an imported data set contains a column “Formulation” with values T (for the test drug) and R (for the reference drug), specifying the following inside a placeholder will replace all occurrences of word “T” inside the table with “test” and “R” with “reference”:
renamings:
    T: test
    R: reference
For categorical covariates, it is possible to specify both the covariate name and the covariate modality to be repaced, in order to avoid ambiguities if category “0” appears in several covariates. In addition, quotes can be used if spaces are needed within the springs:
renamings:
    SEX#0: Male
    SEX#1: Female
    RACE#0: Caucasian
    RACE#1: "African american"
    RACE#2: Hispanic
Respecting the indentation before the modalities to replace and the space after the “:” is crucial to have the placeholder properly recognized.
Generating reports from the command line
It is possible to generate a report directly through the command line, without using the PKanalix interface. This can be useful when running PKanalix on a server.
To generate a report via command line, the executable reportGenerator can be called from the lib folder (typically $HOME/Lixoft/MonolixSuite2023R1/lib/):
reportGenerator -p pkanalix_project_path
Multiple options can be provided to reportGenerator:
| -?, -h, –help | Displays the help. |
| -p, –project <path> | Project file to load |
| –tpl, –template <path> | Template .docx file used as reporting base (if not provided a default report file is generated) |
| –onxt, –output-next-project <[true], false> | Generate report next to project |
| –op, –output-path <path> | Generated report file name (if output-next-project is true) or complete path (if output-next-project is false) |
| –tab, –tables-style <style> | Table style sheet applied on generated tables |
| –wt, –watermark-text <text> | Watermark text |
| –wff, –watermark-font-family <[Arial], …> | Watermark font family |
| –wfs, –watermark-font-size <integer> | Watermark font size |
| –wc, –watermark-color <[255:0:0]> | Watermark color (RGB) |
| –wl, –watermark-layout <[horizontal], diagonal> | Watermark layout |
| –wst, –watermark-semi-transparent <[true], false> | Watermark semi-transparent |