Purpose
This plot, available with version 2024, enables the interpreted data for NCA to be displayed in the same way as the observed data. The interpreted data in the plot takes into account exclusions, filters and censoring rules.
While executing the NCA task, the NCA plot is automatically generated alongside the standard set of plots.
 Compared to the Observed data plot, the following data processing rules have been applied:
- additional points at dose time (if not present in original dataset)
- points before the last dose of each profile (i.e occasion or subject) are removed
- BLQ data is replaced according to the chosen NCA settings (BLQ after Tmax and BLQ before Tmax)
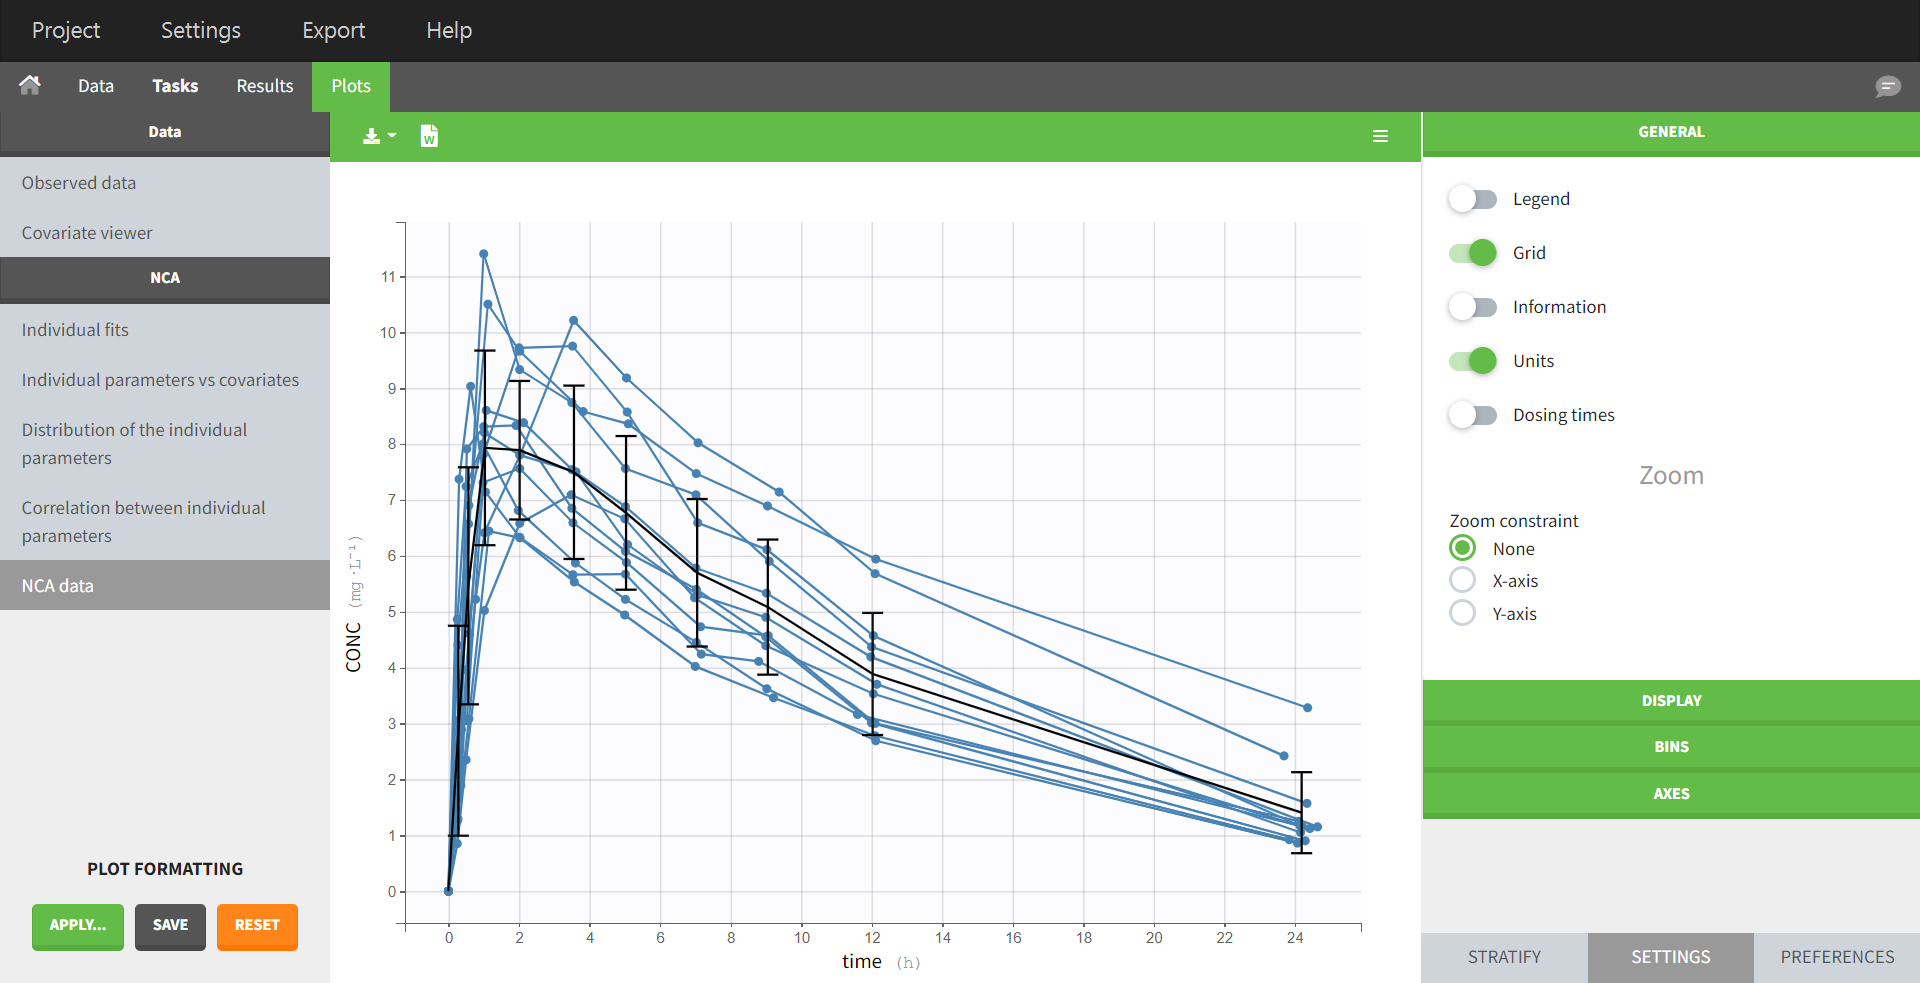
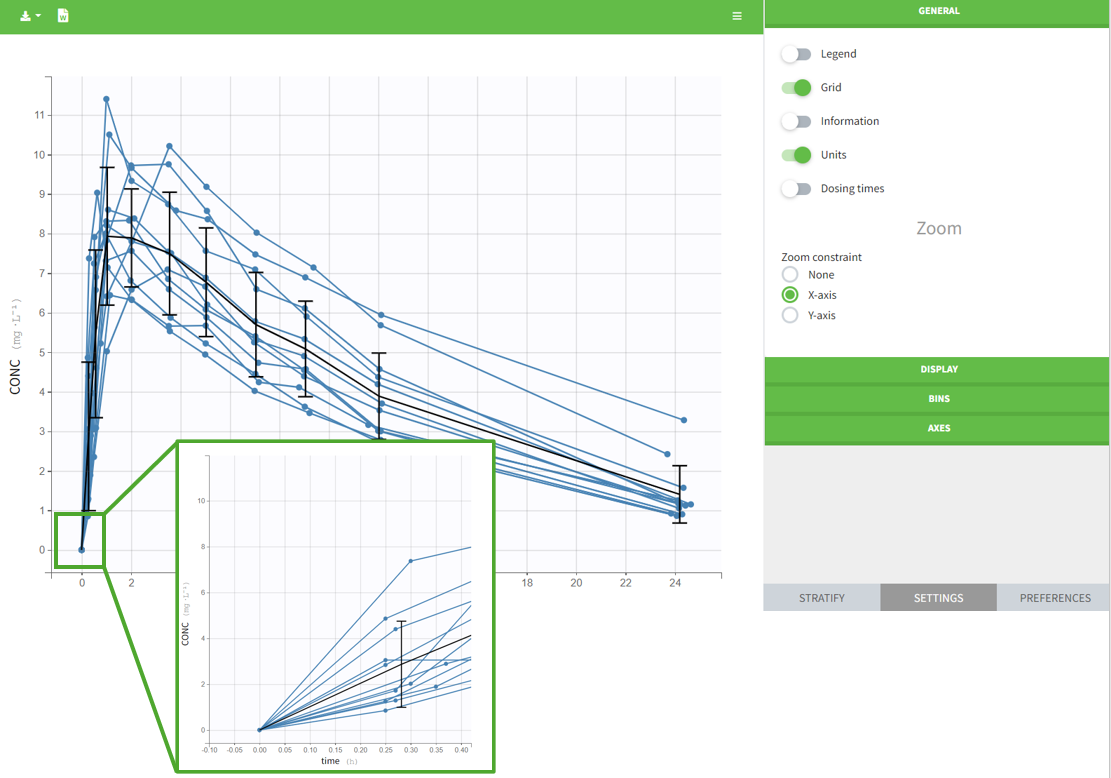 Besides these two mentioned differences from the observed data plot, the NCA data plot offers the same plot settings and stratification properties. Note the option to display the x-axis as nominal time.
Sparse data
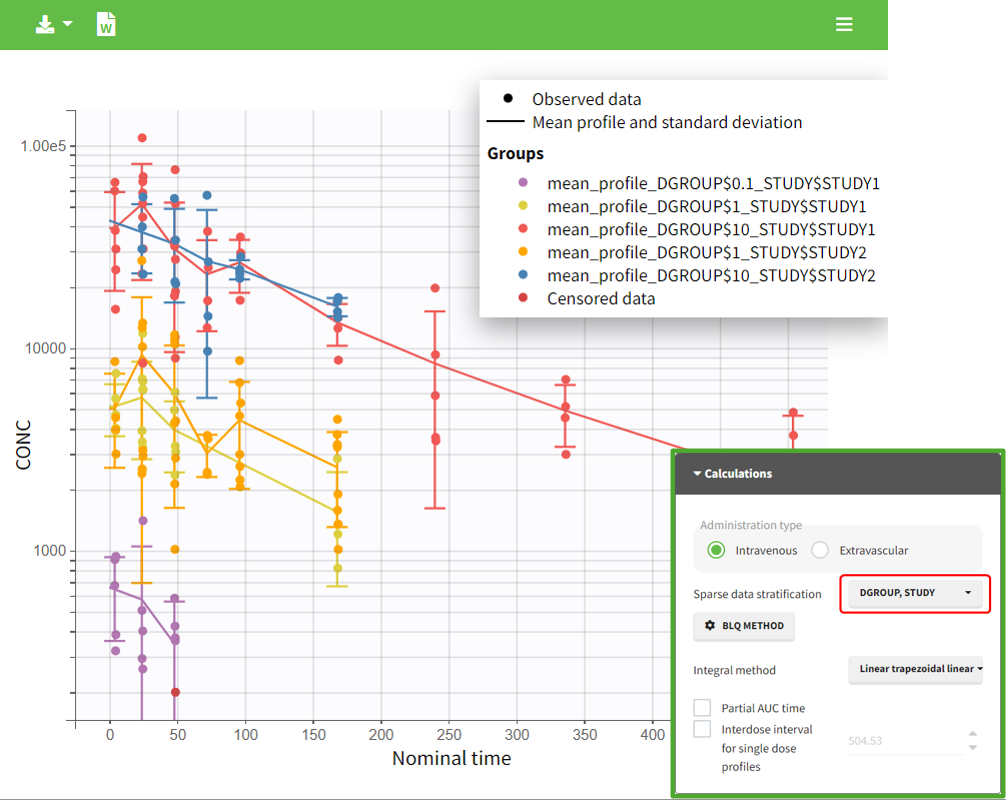
The NCA plot for sparse data differs in certain points from the one for dense data.
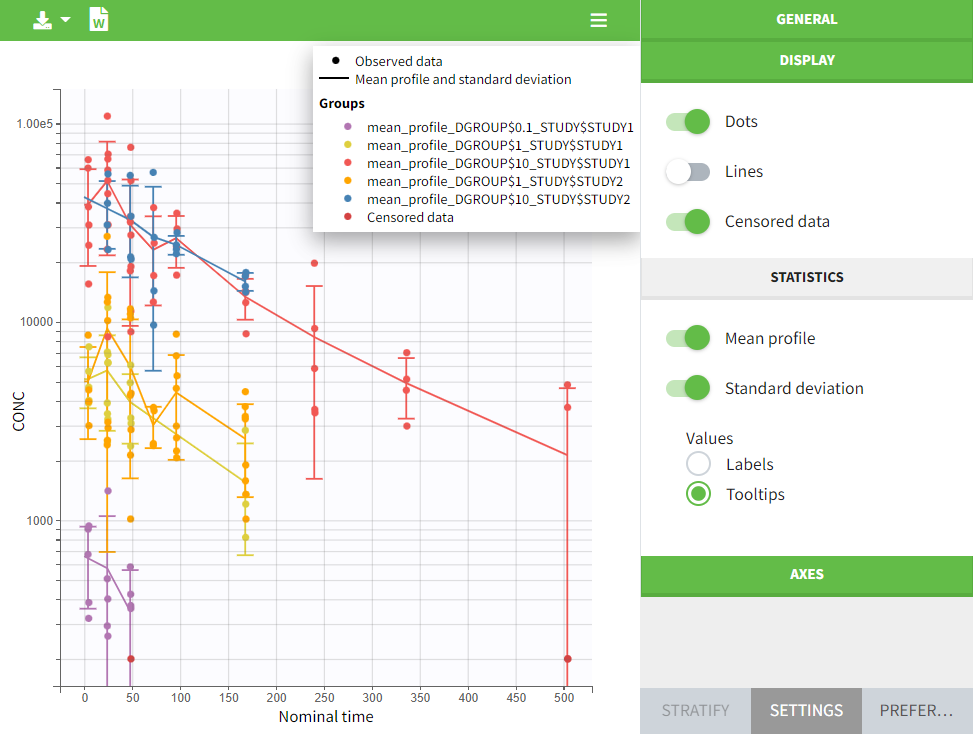
- Stratification
Due to the enforced stratification in the calculation settings, the data also appears according to this stratification in the plots tab. No further stratification settings are possible in the plots tab that deviate from the stratification specified in the calculations panel in the NCA tasks tab.
- Trend line
The data is summarized using the arithmetic mean, which is represented by a trend line in the plot. Unlike for dense data in the NCA plot or in the observed data plot, there is no option to select an alternative mean value formula. However, it is possible to display or hide these metrics, arithmetic mean and standard deviation, in the plot using their associated toggles.
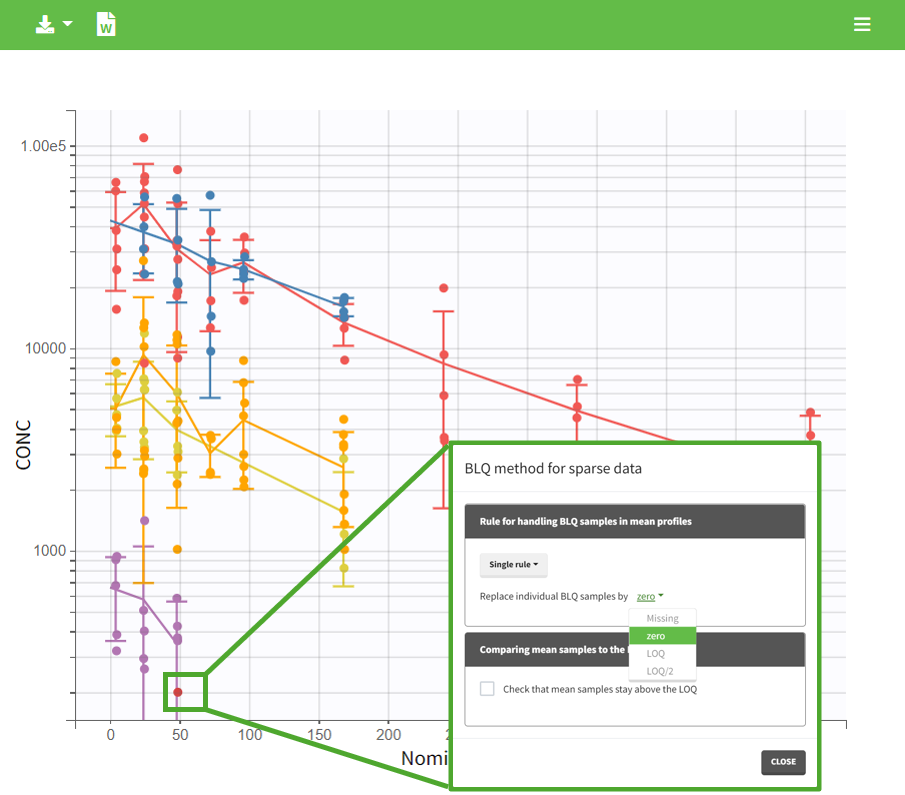
- Censored data
The rules defined in the NCA task tab for handling censored data are also considered in the calculation and therefore also in the display of the mean curve and the associated error bars in the in plot.
- Nominal time
If nominal time is present in the dataset, it serves as the time variable in calculations and is consequently enforced as the x-axis in the plot, with no option of changing it.