Purpose
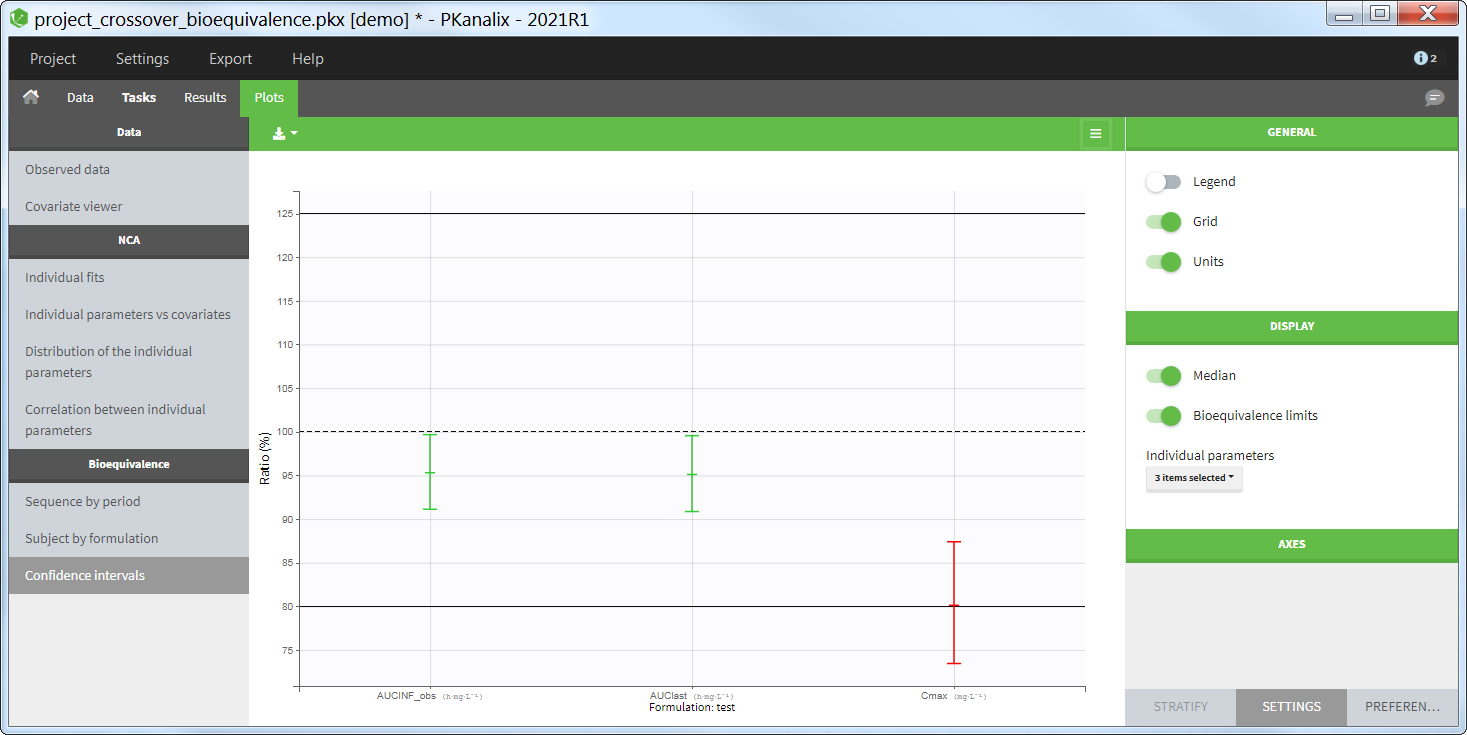
This plot allows to visualize the confidence interval for the ratio for each parameter, as well as the BE limits. Confidence intervals within the BE limits are shown in green while the others are shown in red.
Settings
- General
- Legend: hide/show the legend. The legends adapts automatically to the elements displayed on the plot. The same legend box applies to all subplots and it is possible to drag and drop the legend at the desired place.
- Grid : hide/show the grid in the background of the plots.
- Units: hide/show the units of the NCA parameters. Note that the color and surrounding character can be chosen in the plot “Preferences”.
- Display
- Median: hide/show the line at ratio=100%.
- Bioequivalence limits: hide/show the horizontal lines at the BE limits, which can be set in the BE settings
- Individual parameters: select which individual parameters to show on the plot
Stratify
This plot cannot be stratified by covariates.