PKanalix automatically generates results after running the CA task calculations. This page contains a complete list of output tables and files.
Output tables
Compartmental analysis results are displayed in tables in the “RESULTS” tab, in the CA section.
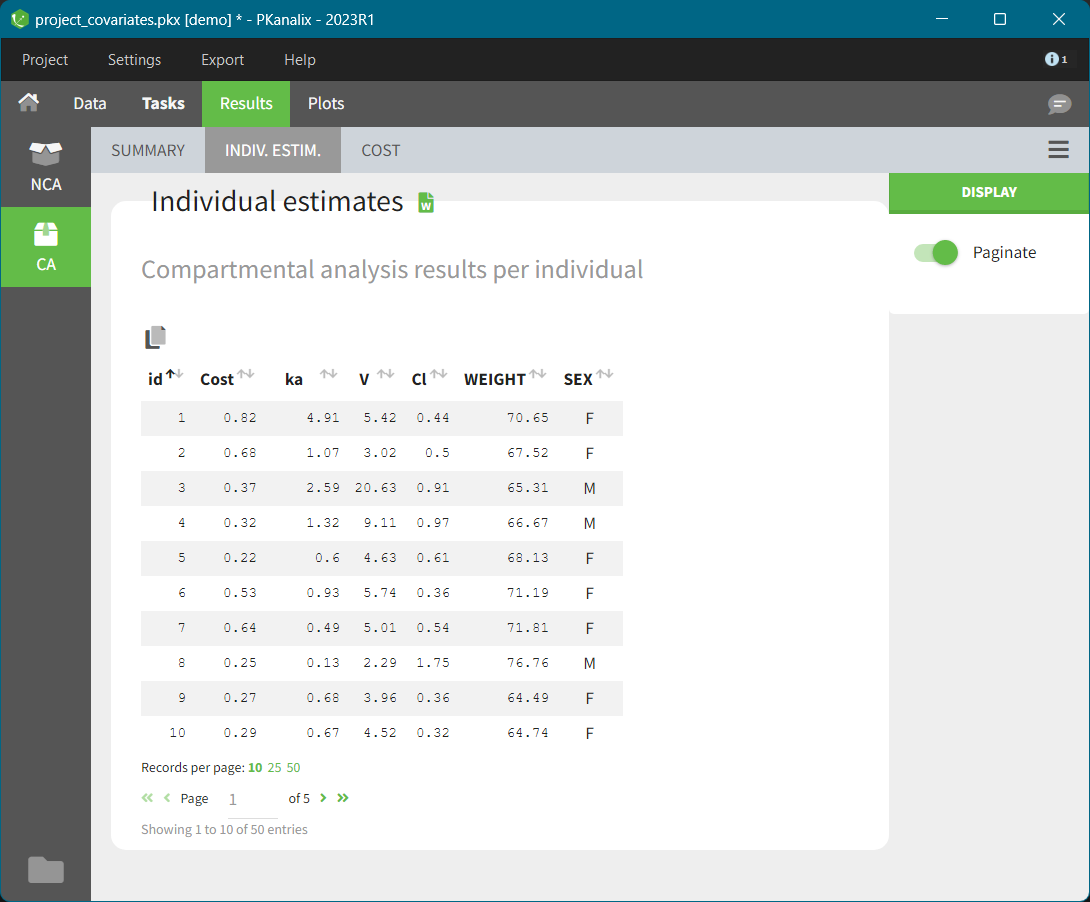
INDIV. ESTIM.
In this table (shown above) you find results of the compartmental analysis for each individual: model parameters values, cost function values, covariates (from the dataset). By default, the table shows 10 records (ids) per page. To increase it and to see following pages, use settings below the table.
SUMMARY
This table contains statistics on compartmental analysis results and summary calculation. The complete list with description is here.
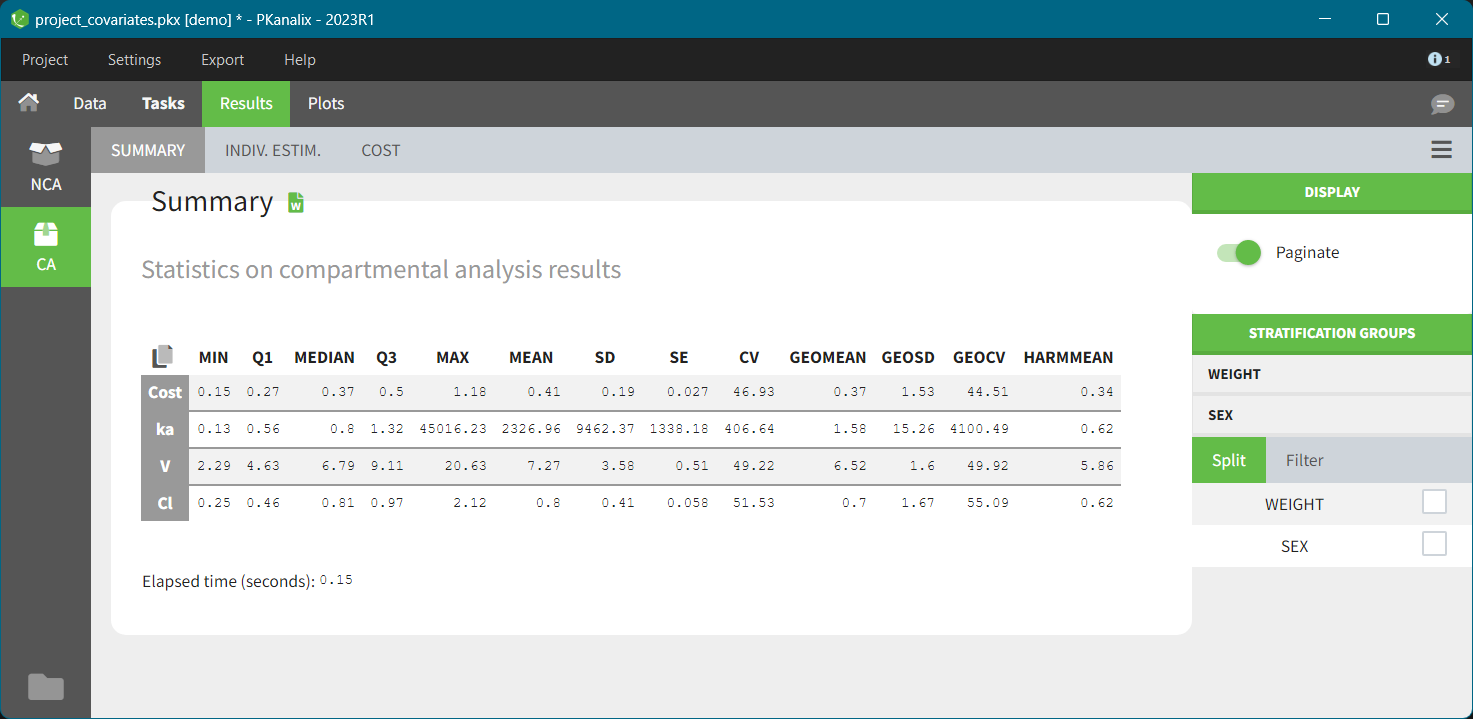
For better comparison you can split or filter this table using covariates present in a dataset. When you select split/filter PKanalix automatically re-calculates the values and displays them. The following Feature of the week video explain how this feature works on the NCA individual estimates table example.
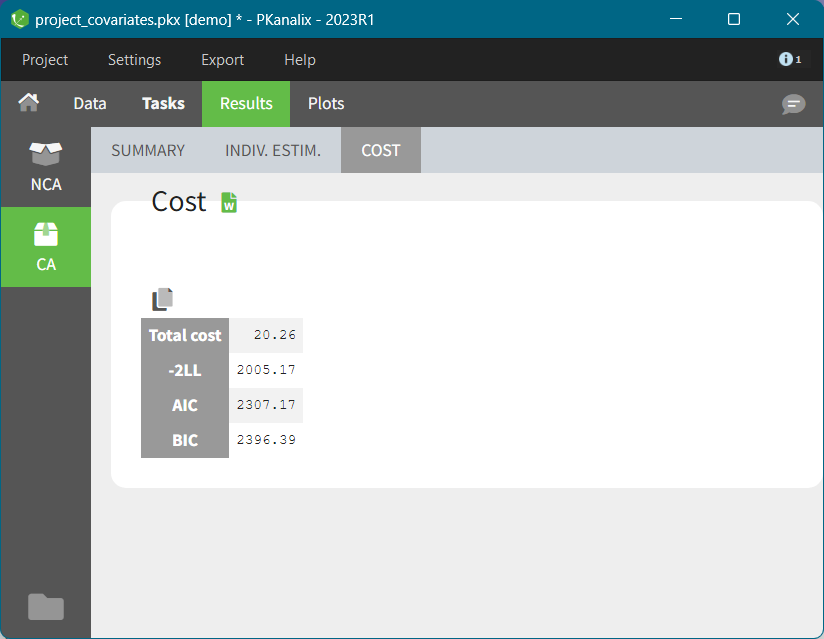
COST
This table contains information about model comparison indices calculated for the model selected in the CA task. It includes: total cost (sum of individual costs values shown in the INDIV. ESTIM. sub tab), -2LL, AIC and BIC, see here for details about the formulas. This information criteria allow to compare statistically the fit obtained with different models. The rule of thumb is: the lower the value of the information criteria, the better the model fit. There is no absolute value to compare with, important is only the relative difference between two models.
Output Files
You can find the compartmental analysis results also in the project results folder in the “IndividualParameters > ca” directory. There are fours .txt files:
summary.txt
Description: human readable summary file.
Outputs:
- Header: project file name, date and time of run, PKanalix version
- Table: Summary statistics of the individual cost function and individual model parameters
caIndividualParameters.txt
Description: Individual parameters estimates
Outputs:
- ID: subject name and occasion (if applicable). If there is one type of occasion, there will be an additional(s) column(s) defining the occasions.
- Cost: value of the individual cost function
- parameterName: individual model parameter values estimated during the compartmental analysis.
- COVname: continuous covariates values corresponding to all data set columns tagged as “Continuous covariate”.
- CATname: modalities associated to the categorical covariates.
caIndividualParametersSummary.txt
Description: Statistics summary of individual parameters estimates
Outputs:
- ID: subject name and occasion (if applicable). If there is one type of occasion, there will be an additional(s) column(s) defining the occasions.
- Parameter: cost and model parameters
- Statistics: min, Q1, median, Q3, max, mean, SD, SE, CV, geoMean, geoSD, geoCV, harmMean
cost.txt
Description: Total cost and information criteria of a model
Outputs:
- Cost: Total cost, see formulas above
- Log-likelihood estimation: -2LL, AIC, BIC