Purpose
This plot can be used for two purposes:
- show the terminal slope (lambdaZ) linear regression for each occasion of each individual (default)
- show the individual concentration data with one individual per subplot and all occasions
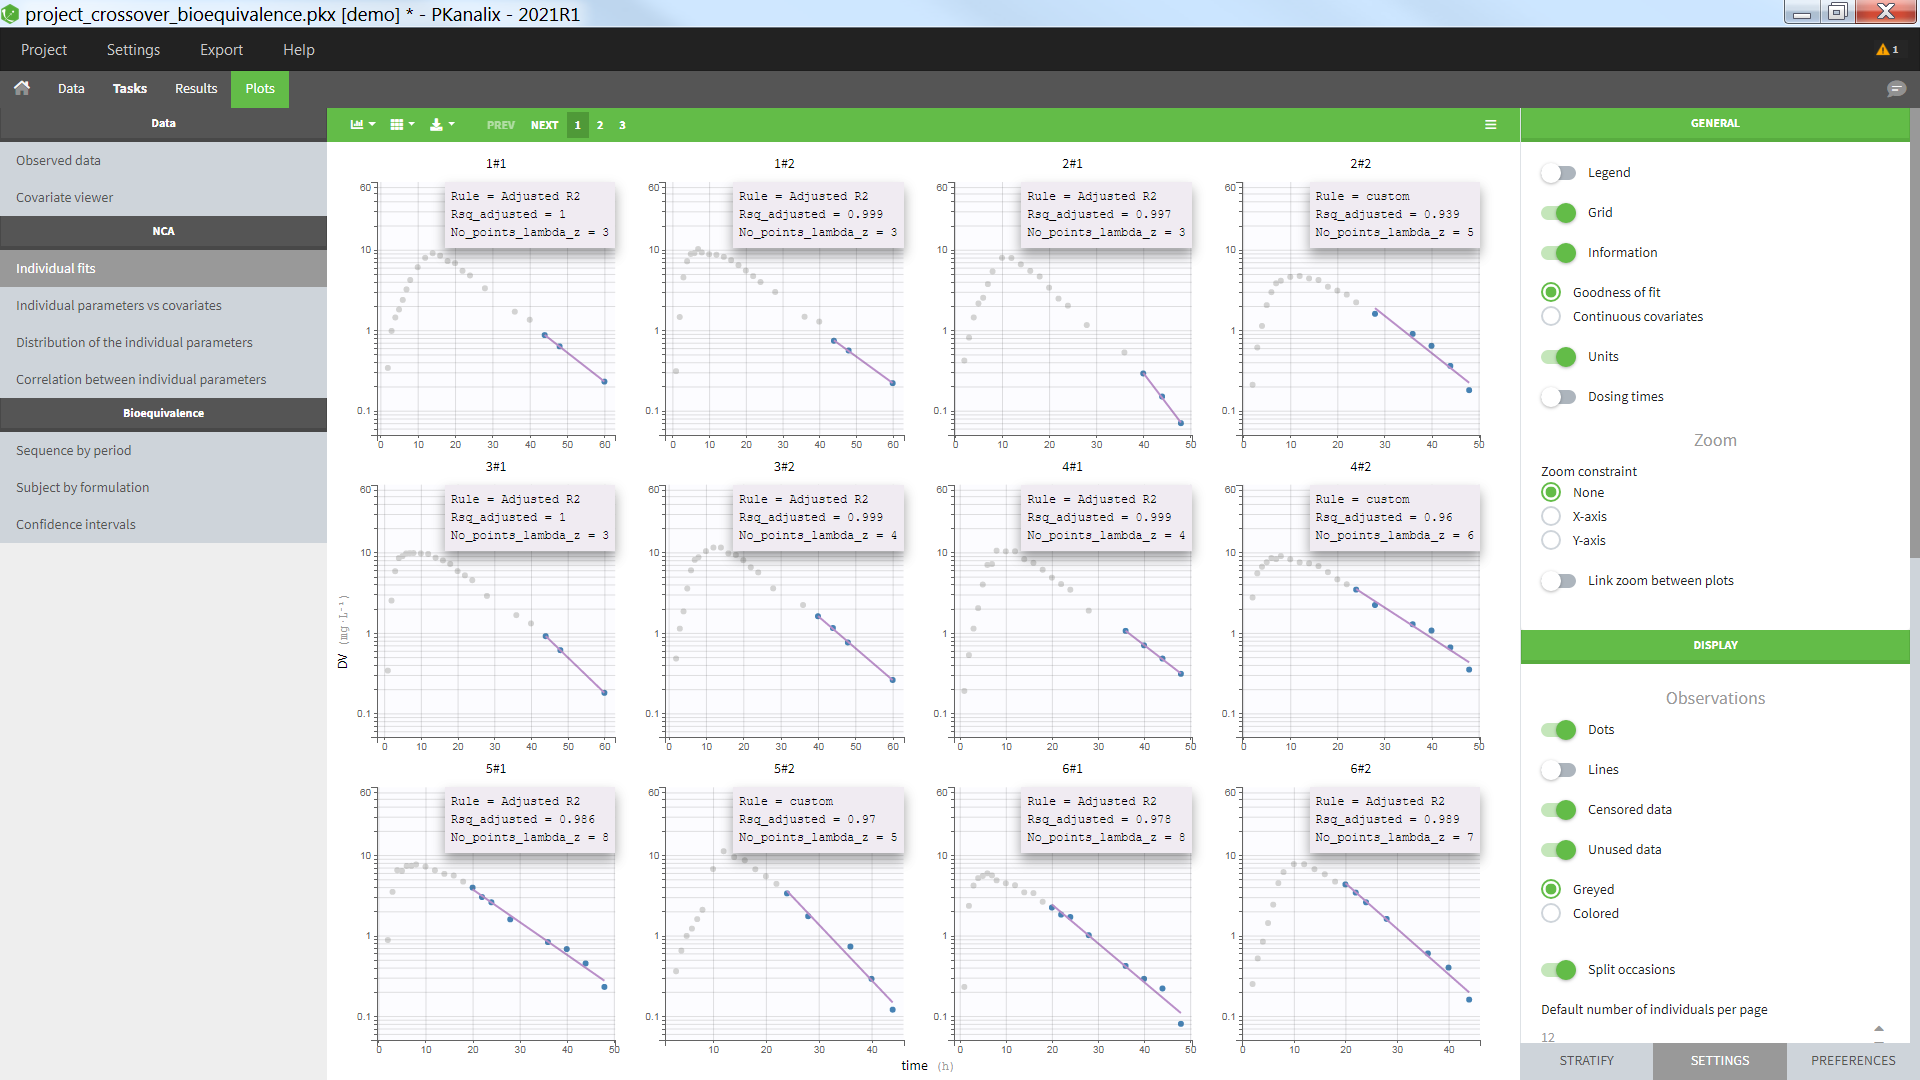
LambdaZ terminal slope
By default, the settings let you see each occasion of each individual on a subplot, in y log-scale with the lambdaZ linear regression. Note that the NCA parameters Lambda_z and Lambda_z_intercept need to be selected in the “Computed parameters” of NCA settings in order to display the lambdaZ regression line.
Selecting the “Information” toggle allows you to display information about the rule used to calculated the lambdaZ (“Adjusted R2”, “R2”, “Interval”, “Points” or “custom” – when points have been manually selected), the number of points included in the calculation and the R2 or adjusted R2 criteria. Again, the NCA parameters Rsq_adjusted, Rsq, and No_points_lambda_z must be selected in “Computed parameters” in the NCA settings in order to appear in the information box.
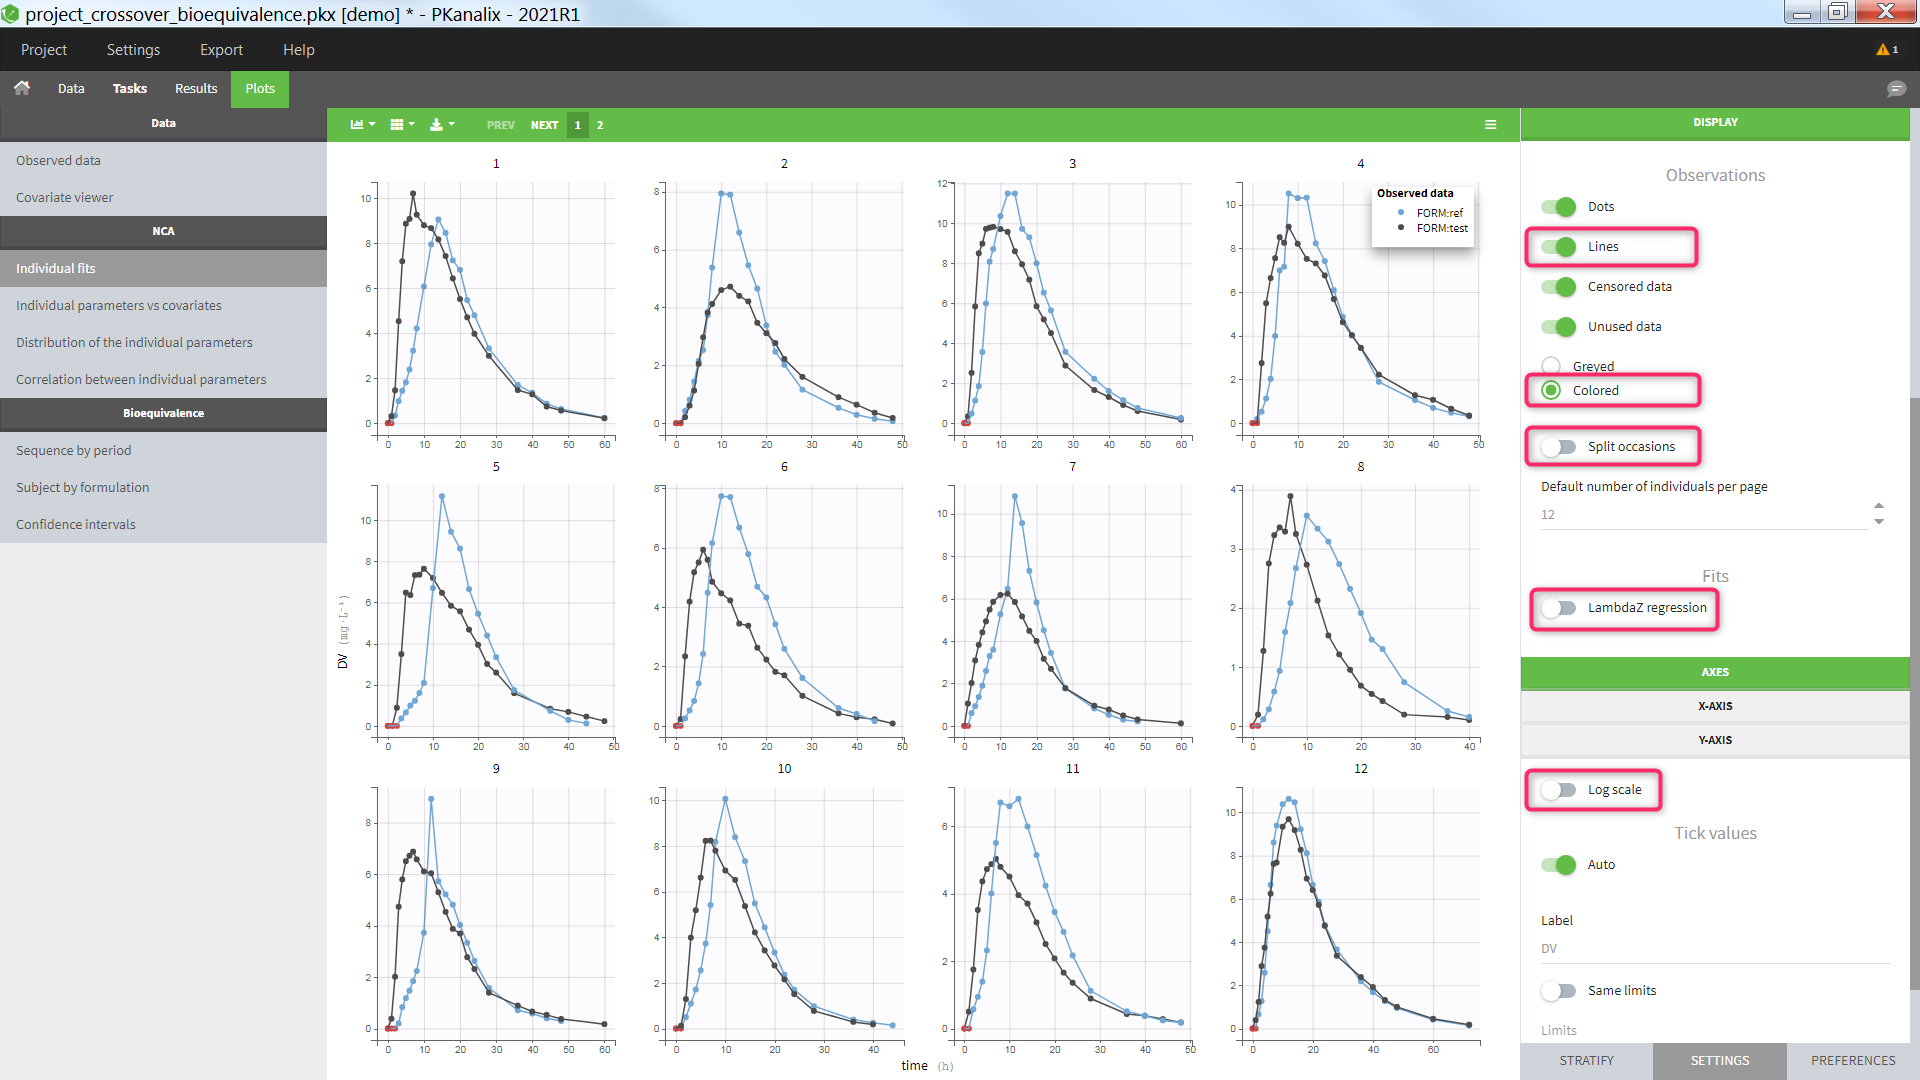
Individual concentration data
The plot can also be used to visualize the individual concentration data with one individual per subplot and occasions all together. For a crossover study with two periods and two formulations for instance, one can:
- display the “Lines”
- display the “unused data” as “colored”
- hide the “LambdaZ regression”
- untick the “split occasions”
- set the y axis in linear scale
- color by the Formulation in the stratify tab
Settings
- Grid arrange (top left above the plot): The user can define the number of subplots displayed, as well as the number of rows and the number of columns. This choice is not saved. See below the “Default number of individuals per page” for a setting that is saved.
- General
- Legend: hide/show the legend. The legends adapts automatically to the elements displayed on the plot. The same legend box applies to all subplots and it is possible to drag and drop the legend at the desired place.
- Grid : hide/show the grid in the background of the plots.
- Information: hide/show
- the continuous covariates: continuous covariates values are displayed for each individual
- the goodness of fit: the rule used to calculate the lambdaZ (“Adjusted R2”, “R2”, “Interval”, “Points” or “custom” – when points have been manually selected), the number of points used to calculate the lambdaZ and the R2 value (if rule=R2) or the adjusted R2 (if rule different from R2). Note that the NCA parameters Rsq_adjusted, Rsq, and No_points_lambda_z must be selected as “Computed parameters” in the NCA settings in order to appear in the information box.
- Units: hide/show the units next to the NCA parameter names. The color and surrounding characters for the units can be chosen in the plot “Preferences”.
- Dosing times: hide/show dosing times as vertical lines for each subject.
- Link zoom between plots: activate the linked zoom for all subplots. The same zooming region can be applied on all individuals only on the x-axis, only on the Y-axis or on both (option “none” in the “zoom constraint”).
- Display
- Dots: hide/show the observed data as dots
- Lines: hide/show the connecting lines between the observed data points
- Censored data [if censored data present]: hide/show the data marked as censored (BLQ), shown as a red dot according to the “BLQ method before/after Tmax” choice in the NCA settings.
- Unused data: hide/show the data points not used for the lambdaZ calculation
- greyed: display the data points not used in the lambdaZ calculation as greyed
- colored: display the data points not used in the lambdaZ calculation with the default color (set in the plot “Preferences”)
- Split occasions [if occasions present]: Split the individual subplots by occasions or group occasions on a single subplot for each individual.
- Default number of individuals per page: Set the number of subplots to display. This setting can be saved, whereas the “grid arrange” on the top left corner is not.
- LambdaZ regression: hide/show the lambdaZ linear regression
- Sorting: Sort the subjects by ID, goodness of fit (R2 or adjusted R2 value) or continuous covariate value in ascending or descending order.