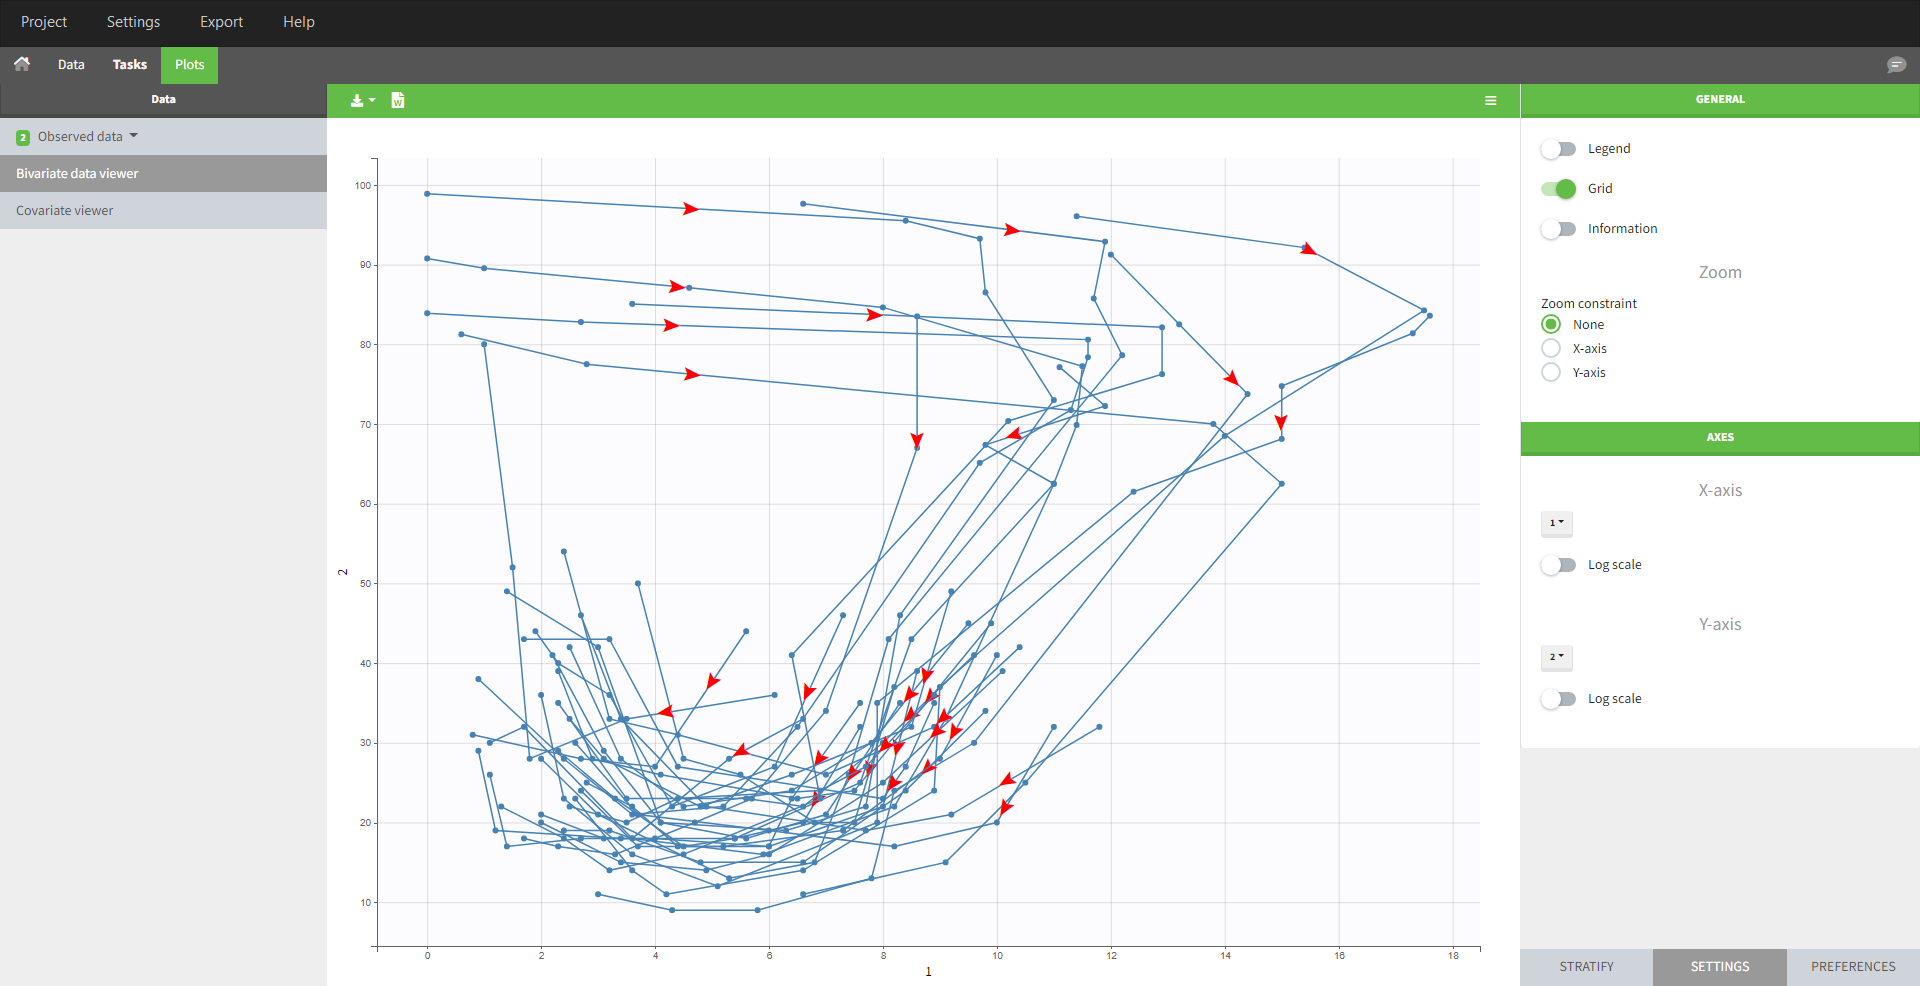
In case of several continuous outputs, one can plot one type of observation w.r.t. another one as on the following figure for the warfarin data set. The direction of time is indicated by the red arrow. Linear interpolation is used for observations of different types that are not at the same time.
Labels for x and y axes correspond to the observation names in the model for data types that are mapped to an output of the model, or observation ids used in the dataset for data types not captured by the model. It is possible to choose which observation id to display on the X or Y axis in the settings panel on the right.