What kind of plots can be generated by PKanalix?
The list of plots below corresponds to all the plots that PKanalix can generate. They are partly generated directly after importing the data, partly after running an analysis task.
Data
- Observed data: This plot displays the original data w.r.t. time as a spaghetti plot, along with some additional information.
- Covariate viewer: This plot displays the matrix of all the covariates in one plot.
- Bivariate data viewer: This plot displays data of different observation types (typically PK and PD data) in one.
NCA
Model for the observations
- Individual fits: This plot displays the individual fits: individual predictions using the individual parameters and the individual covariates w.r.t. time on a continuous grid, with the observed data overlaid.
Diagnosis plots based on individual parameters
- Distribution of the NCA parameters: This plot displays the estimated distributions of the individual parameters.
- Correlation between NCA parameters: This plot displays scatter plots for each pair of individual parameters.
- NCA parameters vs covariates: This plot displays the estimators of the individual parameters w.r.t. the covariates.
CA
Model for the observations
- Individual fits: This plot displays the individual fits: individual predictions using the individual parameters and the individual covariates w.r.t. time on a continuous grid, with the observed data overlaid.
- Observations vs predictions: This plot displays observations w.r.t. the predictions computed using the population parameters or the individual parameters.
Diagnosis plots based on individual parameters
- Distribution of the CA parameters: This plot displays the estimated distributions of the individual parameters.
- Correlation between CA parameters: This plot displays scatter plots for each pair of individual parameters.
- CA parameters vs covariates: This plot displays the estimators of the individual parameters w.r.t. the covariates.
Bioequivalence
- Sequence by period: This plot displays scatter plots for each pair of individual parameters.
- Subject by formulation: This plot displays for each parameter, the subject-by-formulation interaction and the inter-subject variability.
- Confidence intervals: This plot displays the confidence interval for the ratio for each parameter, as well as the BE limits.
- Individual concentration data: This plot displays the individual concentration data with one individual per subplot and occasions all together
Exporting plots
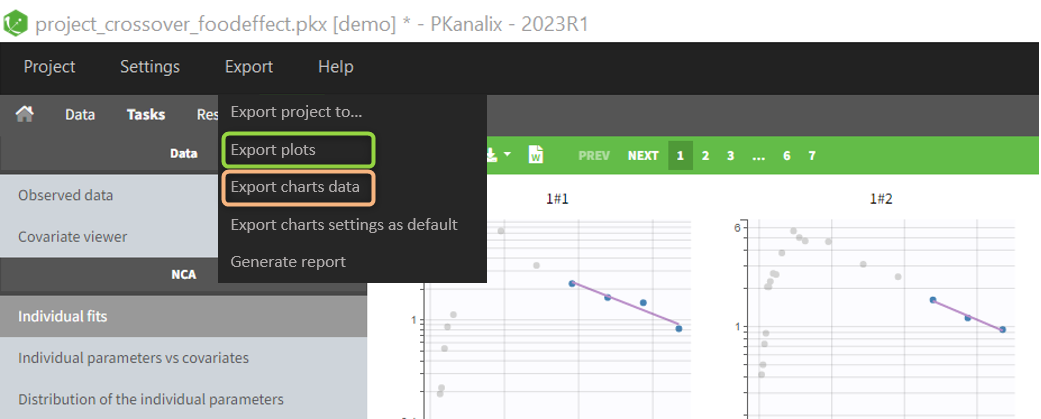
The user can choose to export each plot as an image with an icon on top of it, or all plots at once with the menu Export. It is also possible to export plots data as table, for example to build new plots with external tools.
Note that:
- the export starts after the display of the plots,
- the plots are exported in the result folder,
- only plot selected in Plots tasks are exported,
- legends and information frames are not exported.
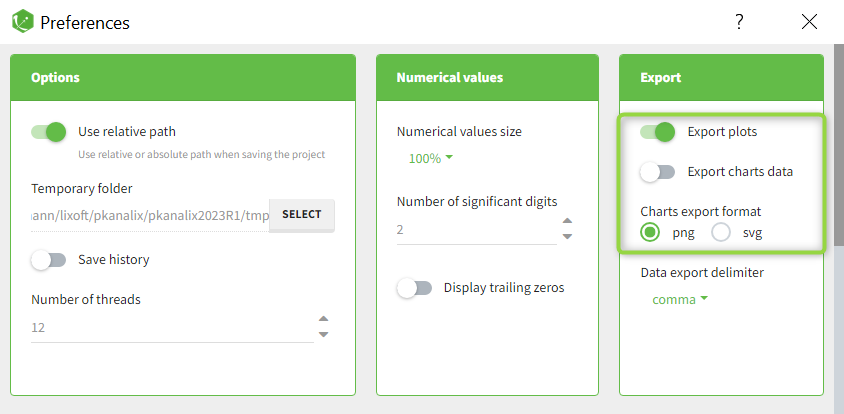
Automatic exporting can be chosen in the project Preferences (in Settings), as well as the exporting format (png or svg):