Purpose
This figure can be used to see the empirical distribution of the CA parameters. Further analysis such as stratification by covariate can be performed and will be detailed below.
PDF and CDF
It is possible to display the theoretical distribution and the histogram of the empirical distribution as proposed below.
 The distributions are represented as histograms for the probability density function (PDF). Hovering on the histogram also reveals the density value of each bin as shown on the figure below
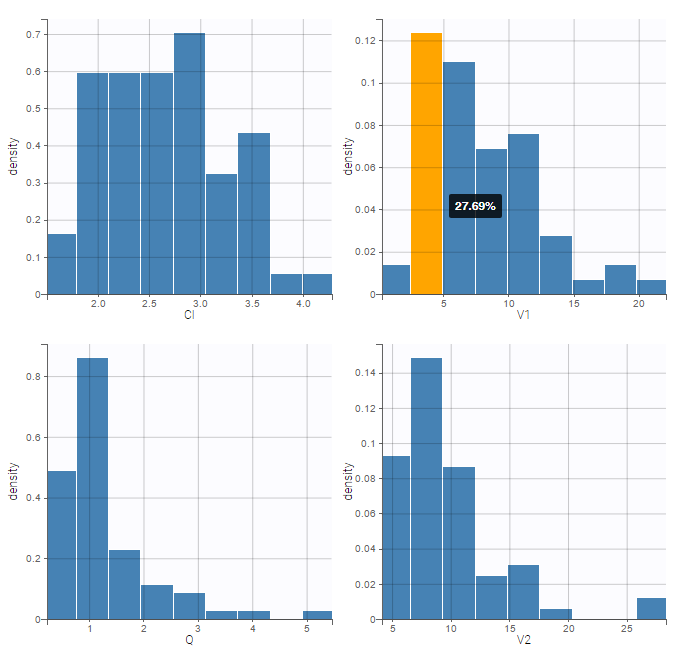
Cumulative distribution functions (CDF) is proposed too.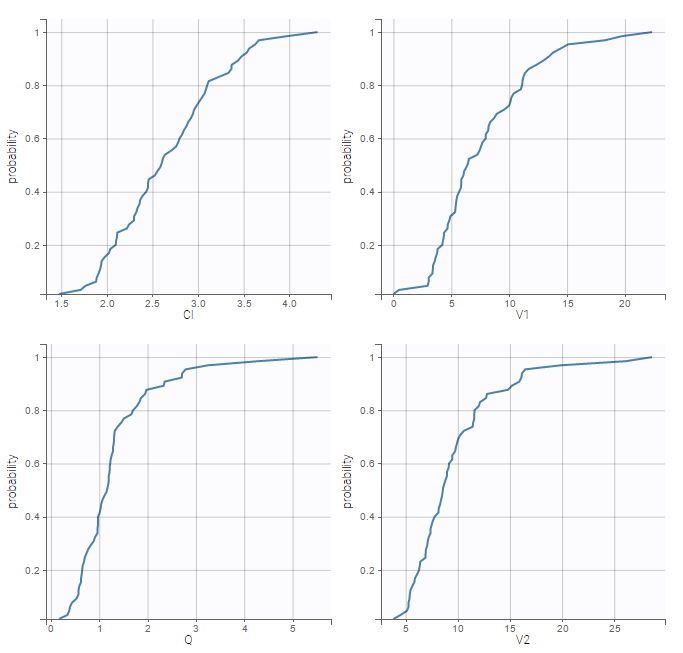
Example of stratification
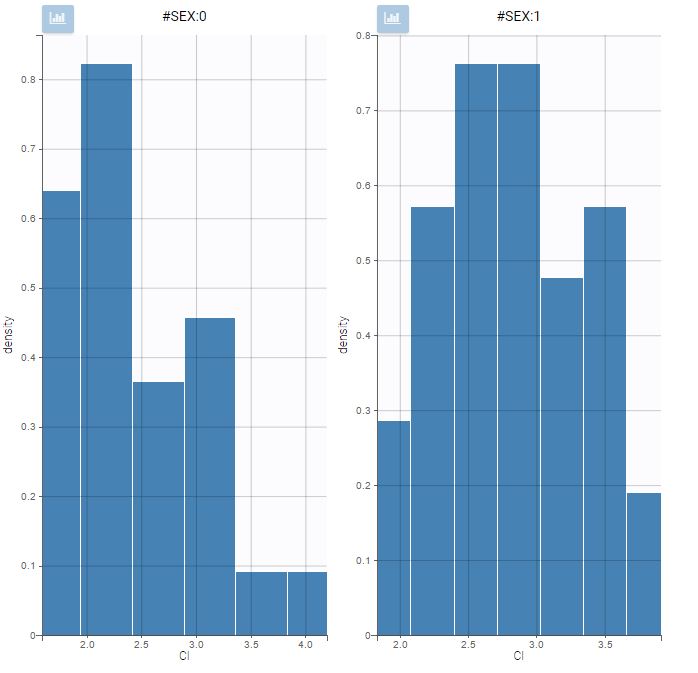
It is possible to stratify the population by some covariate values and obtain the distributions of the individual parameters in each group. This can be useful to check covariate effect, in particular when the distribution of a parameter exhibits two or more peaks for the whole population. On the following example, the distribution of the parameter k from the same example as above has been split for two groups of individuals according to the value of the SEX, allowing to visualize two clearly different distributions.
 Settings
- General: add/remove the legend, and the grid
- Display
- Distribution function: The user can choose to display either the probability density function (PDF) as histogram or the cumulative distribution function (CDF).