Purpose
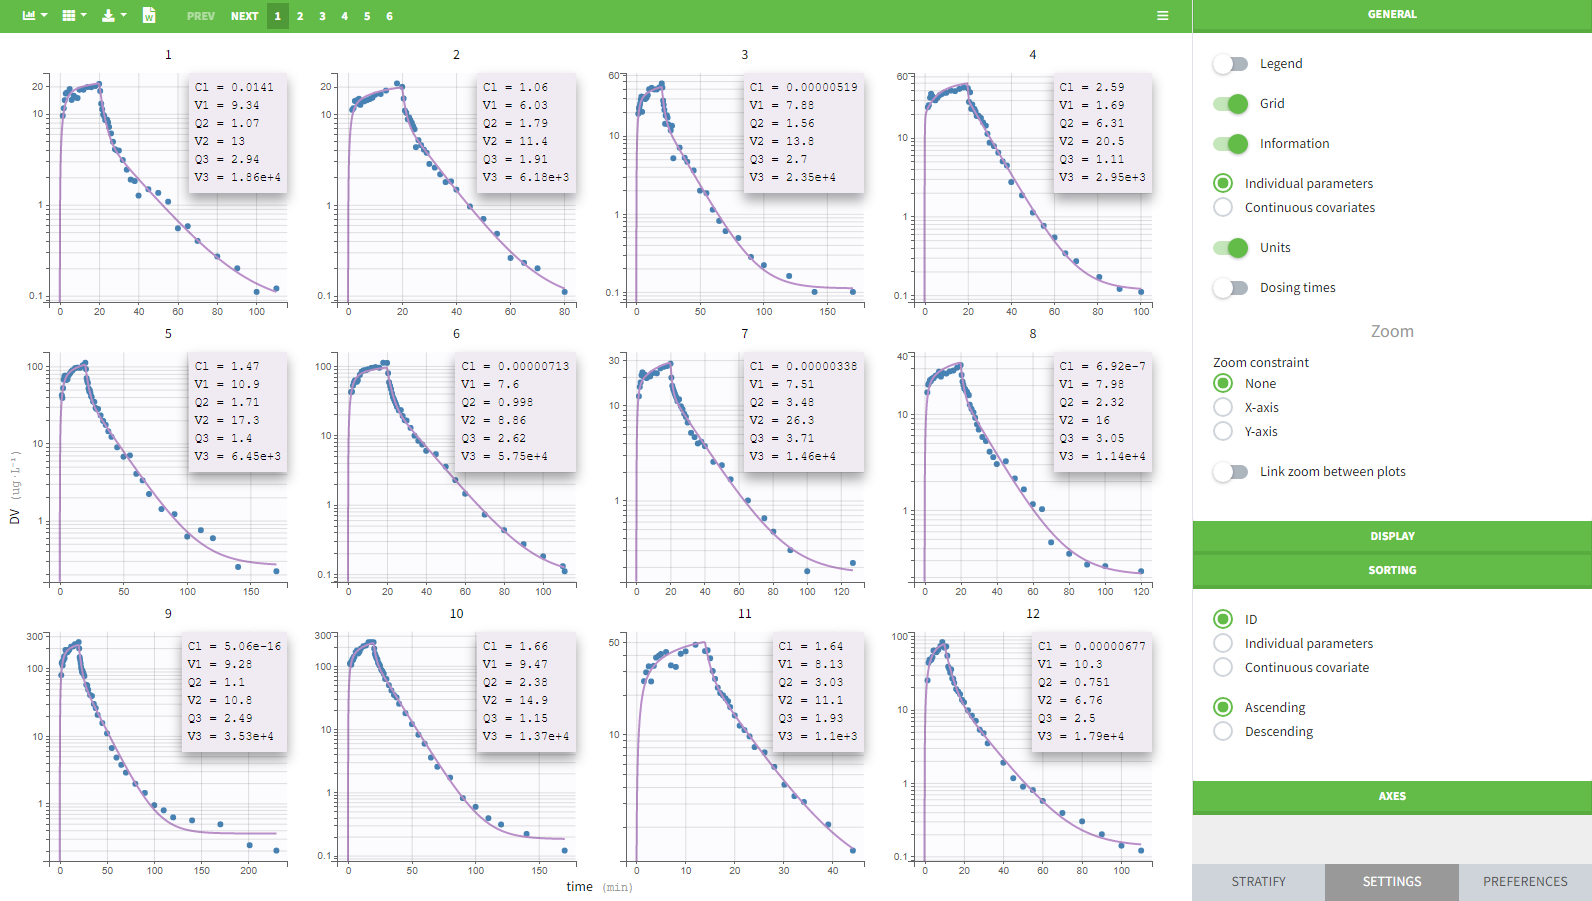
The figure displays the observed data for each subject, as well as prediction using the individual parameters.
Individual parameters
Information on individual parameters can be used in two ways, as shown below. By clicking on Information (marked in green on the figure) in the General panel, individual parameter values can be displayed on each individual plot. Moreover, the plots can be sorted according to the values for a given parameter, in ascending or descending order (Sorting panel marked in blue). By default, the individual plots are sorted by subject id, with the same order as in the data set.

Special zoom
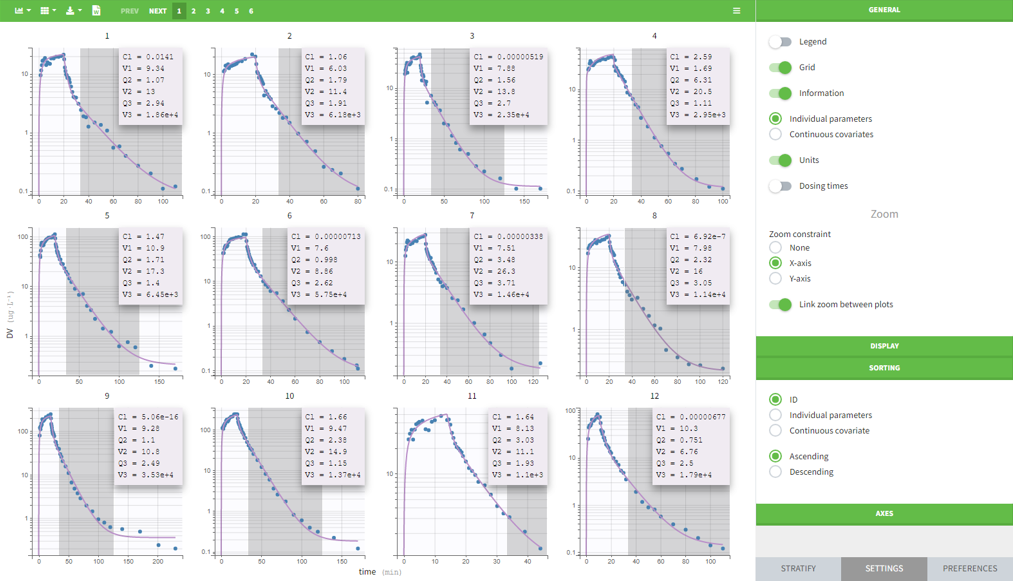
User-defined constraints for the zoom are available. They allow to zoom in according to one axis only instead of both axes. Moreover, a link between plots can be set in order to perform a linked zoom on all individual plots at once. This is shown on the figure below with observations from

Censored data
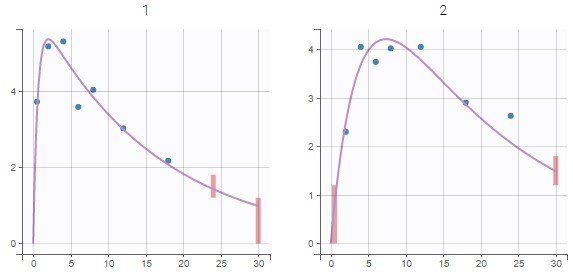
When a data is censored, this data is different to a “classical” observation and has thus a different representation. We represent it as a bar from the censored value specified in the data set and the associated limit.
Settings
- Grid arrange. The user can define the number of subjects that are displayed, as well as the number of rows and the number of columns. Moreover, a slider is present to be able to change the subjects under consideration.
- General
- Legend: hide/show the legend. The legends adapts automatically to the elements displayed on the plot. The same legend box applies to all subplots and it is possible to drag and drop the legend at the desired place.
- Grid : hide/show the grid in the background of the plots.
- Information: hide/show the individual parameter values for each subject (conditional mode or conditional mean depending on the “Individual estimates” choice is the setting section “Display”).
- Dosing times: hide/show dosing times as vertical lines for each subject.
- Link between plots: activate the linked zoom for all subplots. The same zooming region can be applied on all individuals only on the x-axis, only on the Y-axis or on both (option “none”).
- Display
- Observed data: hide/show the observed data.
- Censored intervals [if censored data present]: hide/show the data marked as censored (BLQ), shown as a rectangle representing the censoring interval (for instance [0, LOQ]).
- Split occasions [if IOV present]: Split the individual subplots by occasions in case of IOV.
- Number of points of the calculation for the prediction
- Sorting: Sort the subjects by ID or individual parameter values in ascending or descending order.
By default, only the observed data and the individual fits are displayed.
