For the CA task, PKanalix generates automatically specific plots to help in model diagnosis. Plots are interactive for better data exploration. You can modify display options (lin/log scales, axis limits, etc), stratify (split, color, filter) them using covariates from a dataset, and change the graphical preferences (font size, colors etc).
In the PLOTS tab you will find the following plots:
- Individual fits This plot displays the individual predictions using the individual estimated parameters (or one set of common parameters if you enable the “pooled fit” option) w.r.t. time on a continuous grid, with the observed data overlaid.
- Individual parameters vs covariates This plot displays estimated individual parameters w.r.t. the covariates in the dataset.
- Distribution of the individual parameters. This plot displays the estimated population distributions of the individual parameters.
- Correlation between individual parameters This plot displays scatter plots for each pair of individual parameters.
- Observations vs predictions This plot displays observations w.r.t. the predictions computed using the individual parameters (or one set of common parameters if you enable the “pooled fit” option).
Stratification & Preferences
Stratification of plots in PKanalix works in the same way as in Monolix. Complete description of available options and examples is in the Monolix documentation here.
Save/Export plots and charts data
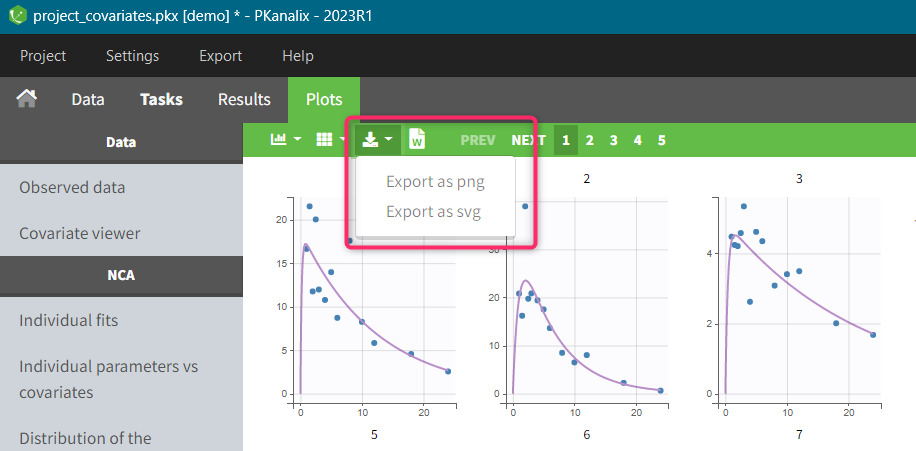
You can export each single plot as an image (png or svg) using an icon on top of each plot. They are saved in the results folder > PKanalix > ChartsFigures.

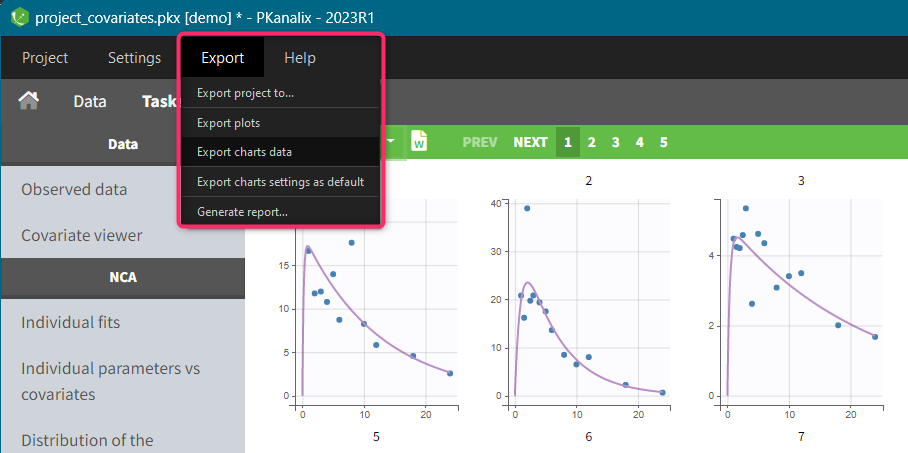
To export all plots at once use the top menu option: “Export > Export Plots”. You can also export plots data as tables (in .txt files), for example to re-generate them with external tools, with “Export > Export charts data”.

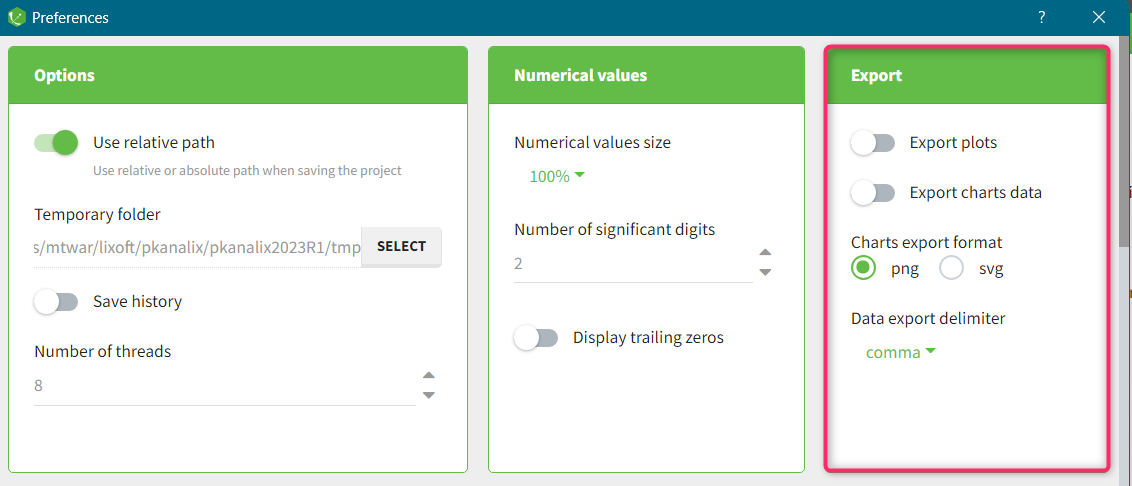
In addition, you can export plots automatically after each CA run. To select this option enable the toggle buttons in the PKanalix Preferences: top menu > Settings > Preferences:

Next section: CA Individual fits plot